


 31 / 40

31
UNEP/GRID-Arendal | Annual Report 2001
| |
Section 3 | Behind GRID-Arendal
Internet statistics
1 2 3 4 5
1 2 3 4 5
1 2 3 4 5
1 2 3 4 5
1 2 3 4 5
1 2 3 4 5
1 2 3 4 5
1 2 3 4 5
1 2 3 4 5
1 2 3 4 5
1 2 3 4 5
1 2 3 4 5
How did you obtain GRID-Arendal's Annual Report?
Personal handout
Workshop/meeting
Internet
Other
How useful did you find the following features?
Board and financial report
Polar activities
Towards decision-making...
Strengthening institutions...
Environmental information products
Staff presentation
Missions and values
Rio to Johannesburg
What do you think about this Annual Report?
Informative
Easy to read
Understandable
Use of graphics
What would you like to see in future issues of GRID-Arendal's
Annual report?
(What can be improved?)
Please add me/my institution to your Annual Report mailing list
If you prefer, you can use our on-line service to fill out this
form. Please go to
www.grida.no/about/AR2001/feedback .Name
Title
Institution
Address
Phone/Fax
User Feedback Form
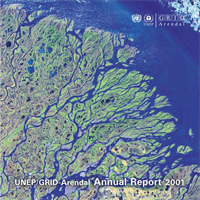
Pages most accessed
3 000 000
2 500 000
2 000 000
1 500 000
1 000 000
500 000
0
News
Baltic
UNEP.NetGEO-2000
CEROI
Maps & Graphics
SoE Norway
EarthPrint
Climate Change
Central and Eastern Europe
14,5% 11,9% 10,9% 5,7% 4,9% 4% 3,3% 3,3% 2,7% 2,6%
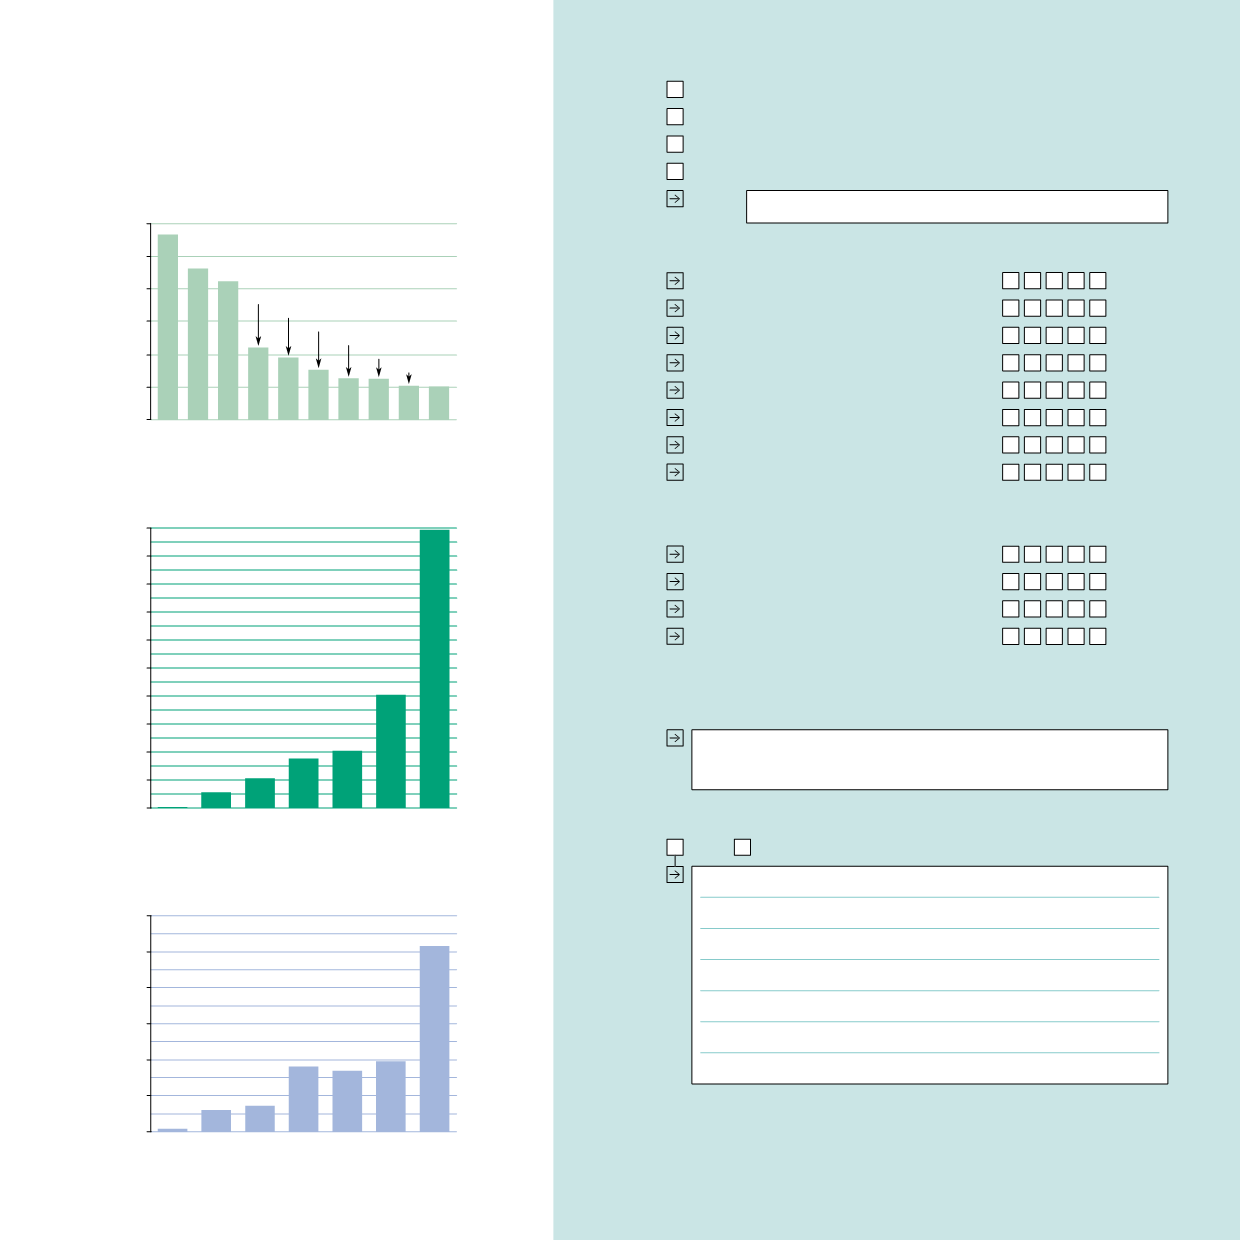
0
20 000
40 000
60 000
100 000
80 000
120 000
1995 1996
1998
1997
2000
1999
2001
On-line distribution of maps and datasets
4 000 000
0
2 000 000
6 000 000
10 000 000
8 000 000
12 000 000
16 000 000
14 000 000
18 000 000
20 000 000
1995 1996
1998
1997
2000
1999
2001
Overall hits
Yes No
not useful
very useful