


 130 / 218


128
Chapter 6
MS
Ld
SHi
lo
aca
AcbSh
AcbC
LAcbSh
IEn
VP
ICj
ICj
Tu1
2
3
VDB
ICjM
LSV
LSI
LSD
CPu
LSS
Pir1
2
3
DEn
AIV
AID
DI
GI
VCl
DCl
S2
acer
VP
lo
rf
aca
cg
ec
gcc
AcbC
AcbSh
LAcbSh
VP
IEn
DEn
E
ICj
Tu1
2
3
LSV
LSD
VCl
ICj
VP
2
3
LSS
AIV
AID
DI
GI
DCl
S1ULp
S1DZO
S1J
S1DZ
S1FL
M1
M2
Cg1
Cg2
LV
CPu
Pir1
acer
Bregma 1.68mm
MS
Ld
SHi
cc
ec
lo
aca
AcbSh
AcbC
LAcbSh
IEn
VP
ICj
ICj
2
3
VDB
ICjM
LSV
LSI
LSD
LV
CPu
LSS
Pir1
2
3
DEn
AIV
AID
DI
GI
VCl
DCl
S2
S1ULp
E
acer
cg
S1DZO
S1J
S1DZ
S1FL
M1
M2
Cg1
Cg2
VP
lo
aca
cg
ec
gcc
AcbC
AcbSh
LAcbSh
VP
IEn
DEn
E
ICj
Tu1
LSV
LSD
VCl
ICj
VP
LSS
AIV
AID
DI
GI
DCl
S1ULp
S1DZO
S1J
S1DZ
S1FL
M1
M2
Cg1
Cg2
LV
CPu
Pir1
acer
Bregma +1.56 mm
Bregma +1.68 mm
Bregma +1.44 mm
Bregma +1.32 mm
Bregma +1.20 mm
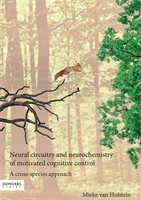
Figure 6.3
Lesion placement showing the extent (left) and peak (right) of the lesion as veri-
fied using Nissl staining for the nucleus accumbens core
Shading indicates the extent (left) or peak (right) of the lesion of each subject. The extent is represented
as the stacked layers across subjects.
(dependent on the task cue) in the high reward context relative to the low reward context
(
figure 6.2
). This was evidenced by a significant reward x task switching interaction (F(1,23)
= 11.395, p = 0.003, η2 = 0.331,
figure 6.2
). Breaking down this interaction revealed that the
switch cost in the low reward context, i.e. a numerically higher accuracy on repeat than switch
trials (F(1,23) = 3.188, p = 0.087, η2 = 0.122,
figure 6.2
), reversed into a switch benefit in the
high reward condition (F(1,23) = 7.411, p = 0.012, η2 = 0.244;
figure 6.2
).