


 10 / 63

8
K
line
et al
.:
J
ournal of
AOAC I
nternational
V
ol
.
100, N
o
.
3, 2017
Empower System Suitability software. The curves for aloins
A and B and aloe-emodin had an R of >0.998. Tailing factors
for the aloin A and B and aloe-emodin peaks were <2.0. The
theoretical plates of the peaks for aloins A and B and aloe-
emodin were >10000 (Table 19).
LOD
The LOD of the method was determined by measuring S/N
from a spiked placebo sample from herbal aloe concentrate
mango at 10 ppb level.
The LOD met acceptance criteria of not more than 10 ppb.
The S/N for aloins A and B and aloe-emodin were 11.8, 9.8, and
7.8, respectively. The LOD of this method was 10 ppb. (This
approach was very conservative because a typical LOD level
requires a S/N of about 3.)
Table 11. Linearity and range standard solutions
Linearity standards
concn, ppb
1 ppm aloin A and B and
aloe-emodin standard,
mL
Final volume, mL
10
2.0
200
20
2.0
100
40
2.0
50
80
2.0
25
160
4.0
25
500
5.0
10
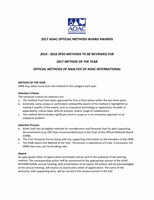
Table 12. Linearity test for aloin A
Concn, ppb
Peak area
10.10
845
20.20
1947
40.39
3829
80.79
7451
161.57
14641
504.92
46321
Table 13. Regression analysis for aloin A
R
0.999964
y
-Intercept
14.03195
Slope
91.62991
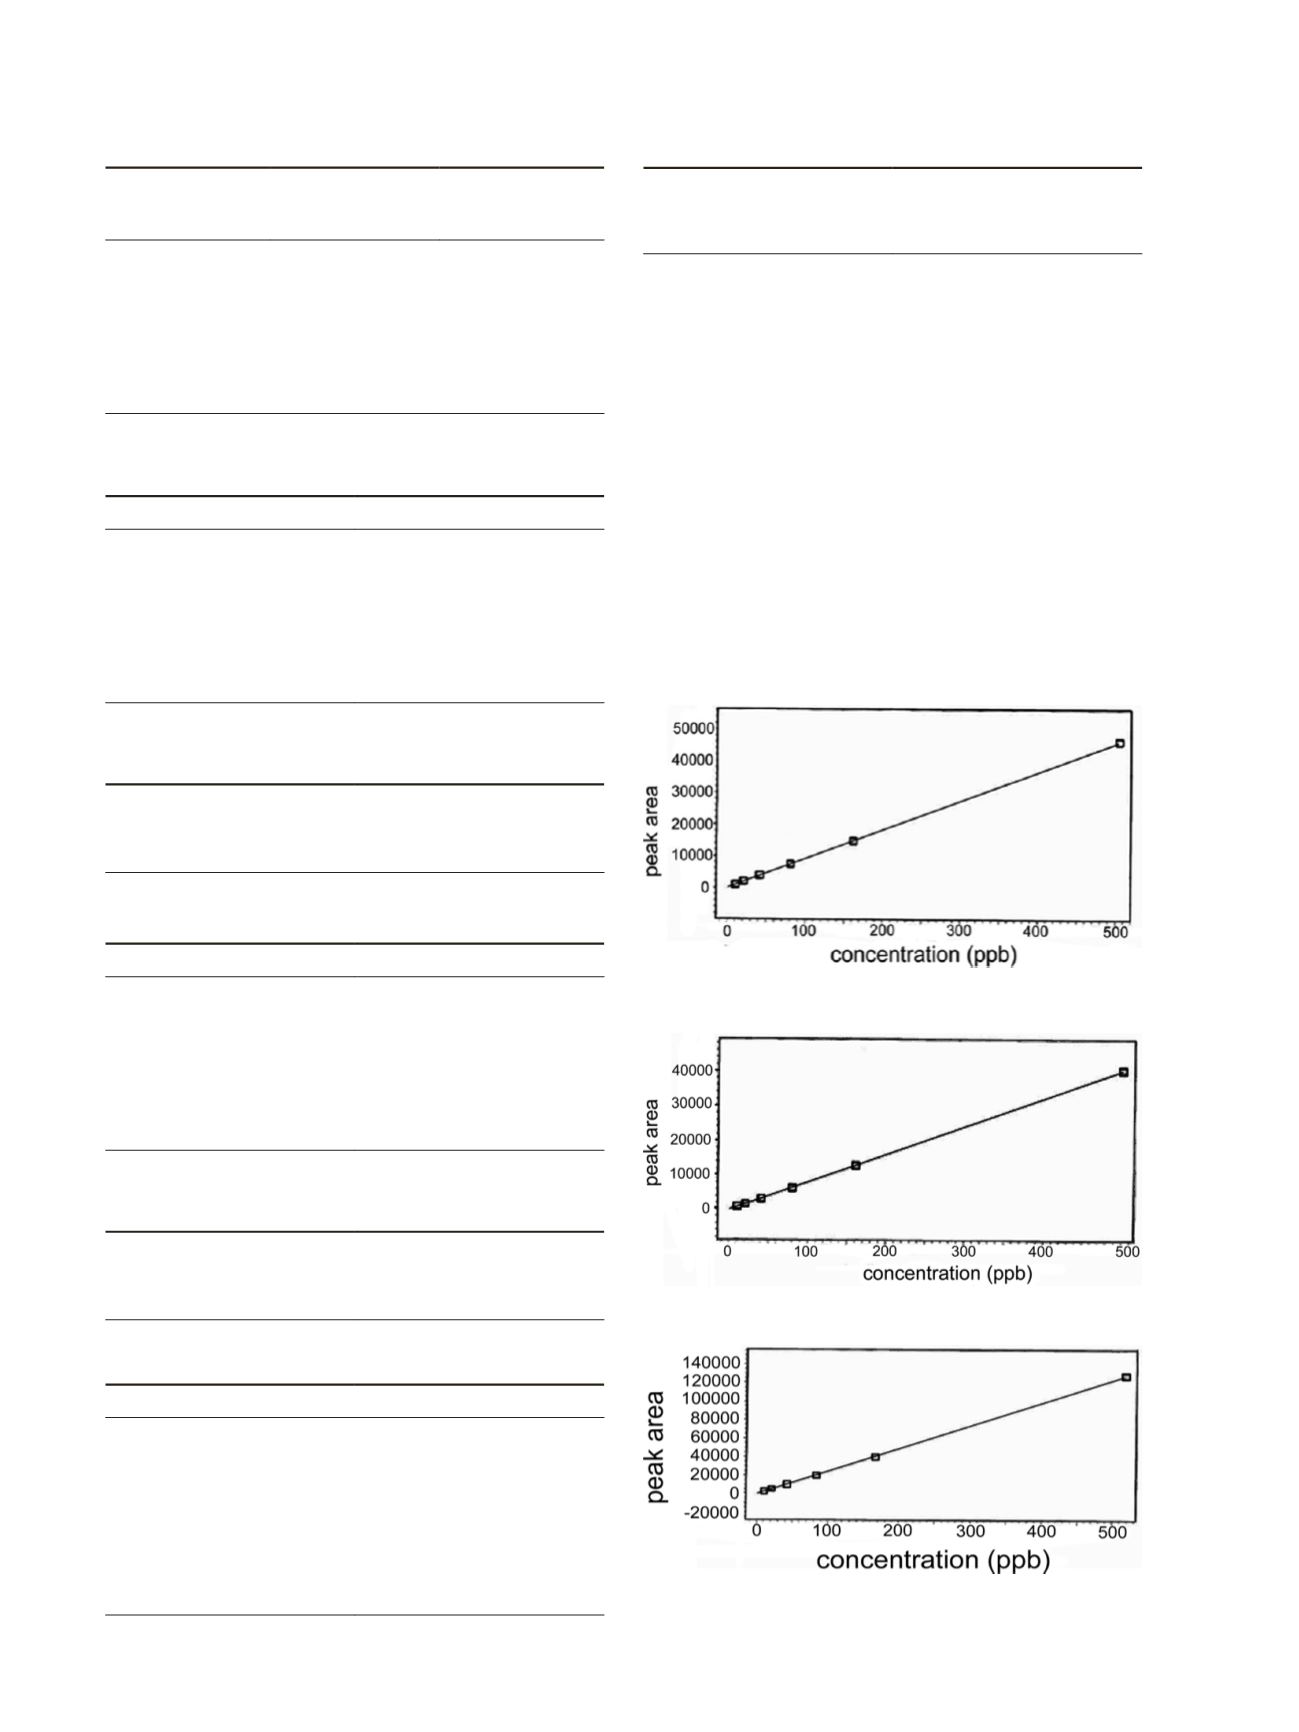
Table 14. Linearity test for aloin B
Concn, ppb
Peak area
10.04
760
20.09
1584
40.17
3143
80.34
6348
160.69
12947
502.15
40416
Table 15. Regression analysis for aloin B
R
0.999957
y
-Intercept
–65.10327
Slope
80.62814
Table 16. Linearity test for aloe-emodin
Concn, ppb
Peak area
10.37
2386
20.74
4896
41.47
9774
82.94
19977
165.89
40316
518.40
128405
Table 17. Regression analysis for aloe-emodin
R
0.999980
y
-Intercept
–461.6635
Slope
248.2991
Figure 4. Linearity plot of aloin A.
Figure 5. Linearity plot of aloin B.
Figure 6. Linearity plot for aloe-emodin.
10