


 7 / 63

K
line
et al
.:
J
ournal of
AOAC I
nternational
V
ol
.
100, N
o
.
3, 2017
5
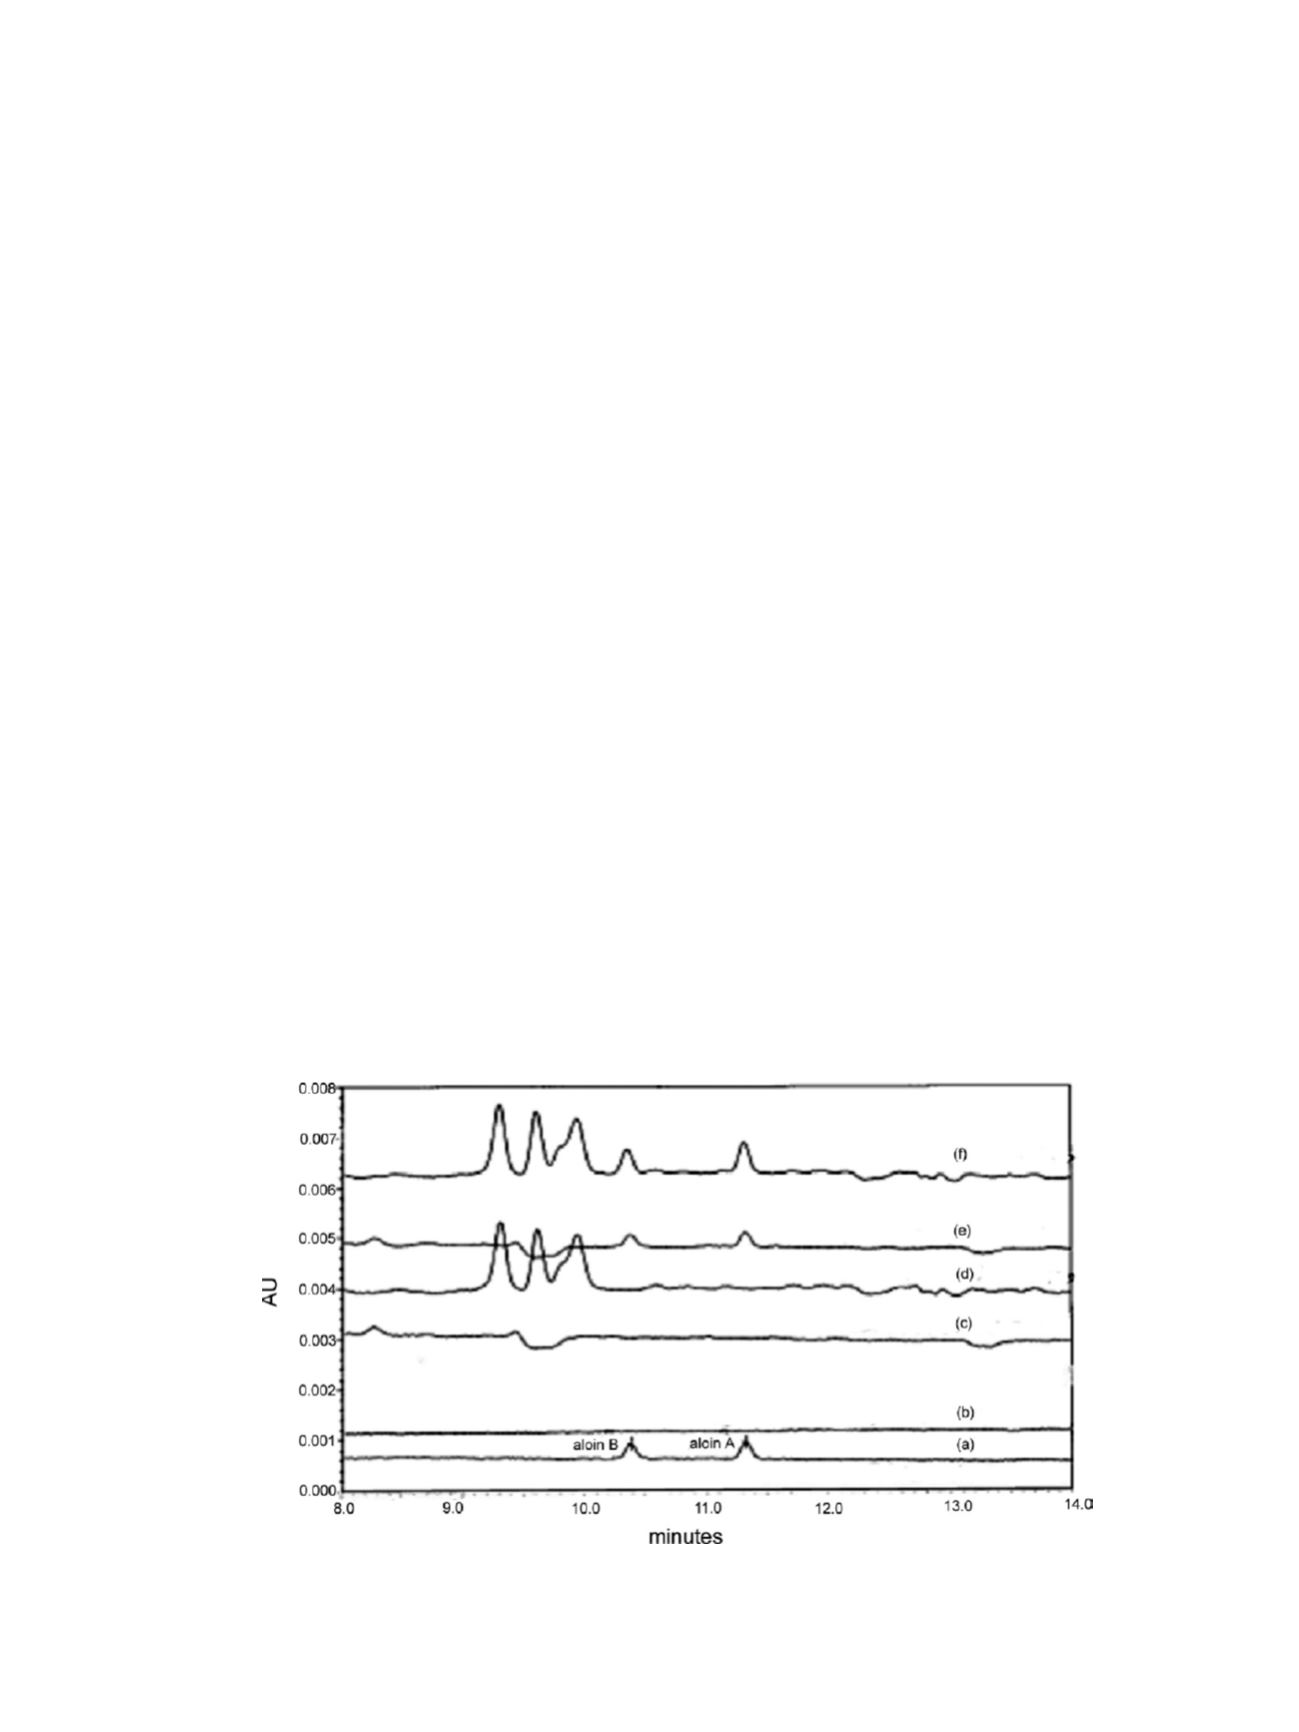
and placebo of liquid concentrate product. When 20 ppb aloins
were spiked into the powder placebo or into the placebo of
liquid concentrate product, aloin peaks were clearly observed
(matching the RTs of the aloin peaks in the standard injection).
For aloe-emodin, the specificity study results clearly
showed that there was no significant interference from the
placebos of either the powder product or liquid concentrate
product (Figure 3).
When 20 ppb aloe-emodin were spiked into the powder
placebo or into the placebo of the liquid concentrate product,
aloe-emodin peaks were clearly observed (matching the RTs of
the aloe-emodin peaks in the standard injection).
Precision
Six replicate samples from each of the four products were
prepared according to the previously described test method.
Samples were analyzed against a freshly prepared standard
solution. The amounts of aloin A and B and aloe-emodin
recovered from each sample were then calculated.
Tables 1–4 show that the RSDs of six test results for aloin A
and B and aloe-emodin for each of the four products were less
than 10%.
Accuracy
Liquid and powder placebo samples were spiked in triplicate
with 10, 20, and 30 ppb spiking solutions of aloins A and B and
aloe-emodin at the 50, 100, and 150% level. The spiked samples
(three concentrations and three replicates of each concentration)
were analyzed according to the internal test method. The amount
of aloins A and B and aloe-emodin in the spiked samples were
calculated as the percentage recovery.
Tables 5–10 show that average recoveries for the spiked
samples were 82.9–100.1% for aloin A, 85.5–89.5% for aloin
B, and 94.2–109.1% for aloe-emodin, which were all within the
acceptable limit range of 80–120%.
Linearity/Range
A standard solution containing 1 ppm of aloins A and B and
aloe-emodin was prepared. Dilutions from the 1 ppm standard
were made to obtain standard solutions containing 10, 20, 40, 80,
160, and 500 ppb of aloinsAand B and aloe-emodin (
see
Table 11).
Three replicate injections were made for each of the six
solutions prepared above. The peak areas for aloins A and B and
aloe-emodin that were obtained for each solution were plotted
against their corresponding concentrations. Linear regression
analyses on the six coordinates were performed.
Tables 12–17 and Figures 4–6 show that the linearity of
detector response for aloins A and B and aloe-emodin in the
range of 10–500 ppb yielded linear correlation coefficients (R)
of 0.9999, which were within the acceptable limit of >0.998.
Ruggedness
The same four products were analyzed (in duplicate) by
a second analyst on a different day, using a different HPLC
system and a different Phenomenex Synergi Hydro-RP HPLC
column. Results were compared with the average results
from the precision test for aloins A and B and aloe-emodin.
Table 18 shows that there was a difference of <10% in
the test results obtained by the two analysts for aloins A and
B. The difference in the test results for aloe-emodin in aloe
vera 5×, aloe concentrate, and aloe powder was <10% and
in the aloe vera gel 200×, the difference was slightly higher,
at 15.7%. The obtained 15.7% difference was considered
justifiable given the method accuracy requirement was 80–
120%. Therefore, 15.7% was within the method accuracy
requirement of 20% variability from 100%.
System Suitability
System suitability parameters for working standards of
aloins A and B and aloe-emodin were calculated using Waters
Figure 2. Aloin region overlay HPLC chromatograms of (a) 20 ppb standard mixture, (b) solvent blank, (c) placebo of the powder product, (d)
placebo of the liquid concentrate product, (e) 20 ppb standard mixture-spiked placebo of the powder product, and (f) 20 ppb standard-spiked
placebo of the liquid concentrate product.
7