


 6 / 63

4
K
line
et al
.:
J
ournal of
AOAC I
nternational
V
ol
.
100, N
o
.
3, 2017
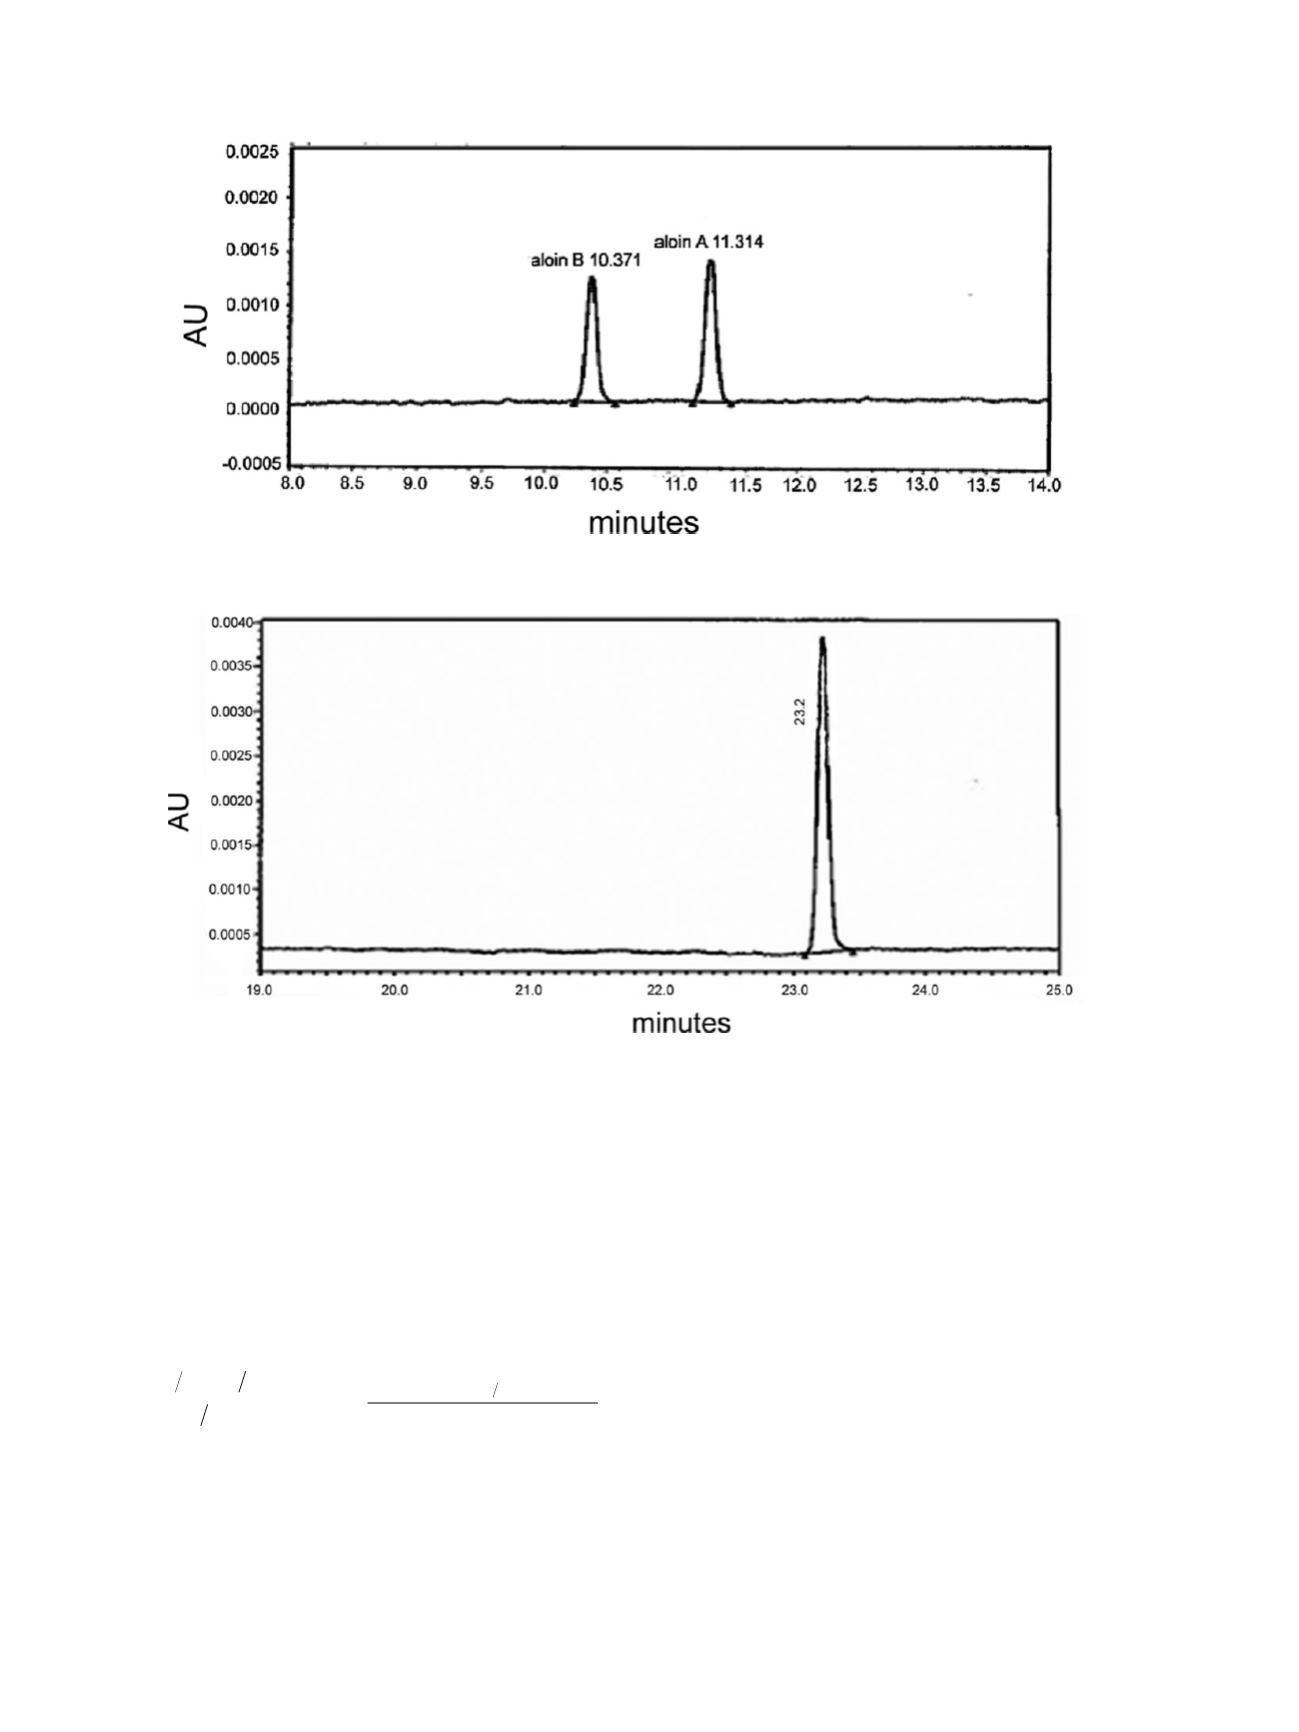
Figure 2016.09B. HPLC chromatogram of an 80 ppb standard mixture injection. B refers to aloe-emodin at 430 nm.
I. Calculations
Obtain the standard curves for aloins A and B (and aloe-
emodin, if necessary) by plotting the standard concentrations
of aloins A and B (and aloe-emodin, if necessary) versus the
peak areas of aloins A and B (and aloe-emodin, if necessary).
Calculate the amount of aloin A and B (and aloe-emodin,
if necessary) in the sample according to the formulas below for
the raw materials and finished products:
aloinA aloin B aloe-emodin
g gor ppm
sampleconcn
DF
samplewt
g mL
mL
g
(
)
(
)
µ
=
×
(
)
( )
( )
µ
where sample concn = the sample concentration from the standard
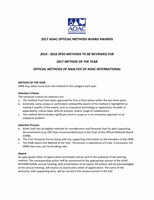
curve and DF = the dilution factor for the sample.Achromatogram
of the aloin A and B standard (80 ppb) at 380 nm is shown in
Figure
2016.09A
. A chromatogram of the aloe-emodin standard
(80 ppb) at 430 nm is shown in Figure
2016.09B
.
Results and Discussion
Single-Laboratory Validation Parameters
This method validation work was conducted following the
guidelines of AOAC INTERNATIONAL criteria for single-
laboratory validation (12).
Specificity
Chromatograms from the blank and placebo runs were
overlaid with the chromatograms from the standard and sample
to show that there was no significant interference at the retention
times (RTs) of the peaks of aloins A and B and aloe-emodin
(Figure 2). No significant interfering peaks were present at the
RTs of aloins A and B and aloe-emodin from the placebo and
blank solution. Two aloin compound peaks from the standard
injection were observed at about 10.4 and 11.3 min. No
interference peaks were observed for the injections (from the
bottom upwards) of solvent blank, placebo of powder product,
Figure 2016.09A. HPLC chromatogram of an 80 ppb standard mixture injection. A refers to aloins A and B at 380 nm.
6