


 14 / 60

116
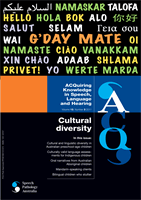
ACQ
Volume 13, Number 3 2011
ACQ
uiring Knowledge in Speech, Language and Hearing
2 including: United Kingdom (
n
= 263, 5.3%), New Zealand
(
n
= 125, 2.5%), China (
n
= 70, 1.4%), Lebanon (
n
= 54,
1.1%), Viet Nam (
n
= 50, 1.0%), and India (
n
= 46, 0.9%).
When the children’s parents were not born in Australia,
the main years of arrival for parent 1 were 1996 (
n
= 70,
1.4%) and 1998 (
n
= 85, 1.7%) (range = 1955–2004)
and for parent 2 were 1988 (
n
= 52, 1.0%) and 1989 (
n
=
69, 1.4%) (range = 1951–2004). Fewer of the children’s
grandparents were born in Australia: parent 1’s mother (
n
=
3010, 60.4%), parent 1’s father (
n
= 2758, 55.3%), parent
2’s mother (
n
= 2476, 49.7%), and parent 2’s father (
n
=
2311, 46.4%).
Aboriginal and Torres Strait Islander
participants
A small number of the children were identified by their
parents as Aboriginal and/or Torres Strait Islanders (
n
=
194, 3.9%). The greatest proportion of children (calculated
as the proportion of the state/territory’s 4- to 5-year-old
children in this sample) were from the Northern Territory (
n
=
8, 17.8% of the 4- to 5-year-old children within the
Northern Territory), and Tasmania (
n
= 13, 10.3%), with the
remainder from Queensland (
n
= 67, 6.8%), New South
Wales (
n
= 65, 3.8%), Western Australia (
n
= 17, 3.5%),
South Australia (
n
= 7, 2.0%), Victoria (
n
= 15, 1.3%), and
Australian Capital Territory (
n
= 1, 1.3%). Across the entire
sample there were 22 children (0.4%) who spoke or
understood an Australian Aboriginal language. A small
number of the children’s parents identified themselves as
Aboriginal and/or Torres Strait Islander (parent 1:
n
= 142,
= 55, 1.1%), and/or LSAC employee (
n
= 65, 1.3%). During
the interviews the LSAC interviewer rated the parents’
proficiency in spoken English. Only parents who spoke
languages other than English were rated. Parent 1 was
rated as speaking English very well (
n
= 555, 11.1%), well
(
n
= 231, 4.6%), not well (
n
= 127, 2.5%), not at all (
n
= 39,
0.8%), and don’t know (
n
= 14, 0.3%). Parent 1 then
reported on parent 2’s ability to speak English. Parent 2
was rated as speaking English very well (
n
= 540, 10.8%),
well (
n
= 218, 4.4%), not well (
n
= 73, 1.5%), not at all (
n
=
18, 0.4%), and don’t know (
n
= 17, 0.3%).
Country of birth and ancestry
The majority of children were born in Australia (
n
= 4774,
95.8%). There were 9 other listed countries of birth: New
Zealand (
n
= 41, 0.8%), United Kingdom (
n
= 31, 0.6%),
South Africa (
n
= 13, 0.3%), India (
n
= 10, 0.2%), USA (
n
=
9, 0.2%), Philippines (
n
= 9, 0.2%), China (
n
= 6, 0.1%),
Kenya (
n
= 5, 0.1%), and Japan (
n
= 4, 0.1%). Additionally,
there were confidentialised data for some children (
n
= 81,
1.6%). For children not born in Australia, the main years of
arrival were 2000 (
n
= 60, 1.2%) and 2001 (
n
= 45, 0.9%).
The majority of the children’s parents were also born in
Australia (parent 1:
n
= 3696, 74.2%; parent 2:
n
= 3045,
61.1%). Their reported countries of birth were diverse.
For parent 1 there were 47 different countries of birth
including: United Kingdom (
n
= 263, 5.3%), New Zealand
(
n
= 126, 2.5%), China (
n
= 79, 1.6%), Viet Nam (
n
= 68,
1.4%), Lebanon (
n
= 62, 1.2%), and Philippines (
n
= 53,
1.1%). There were 48 different countries of birth for parent
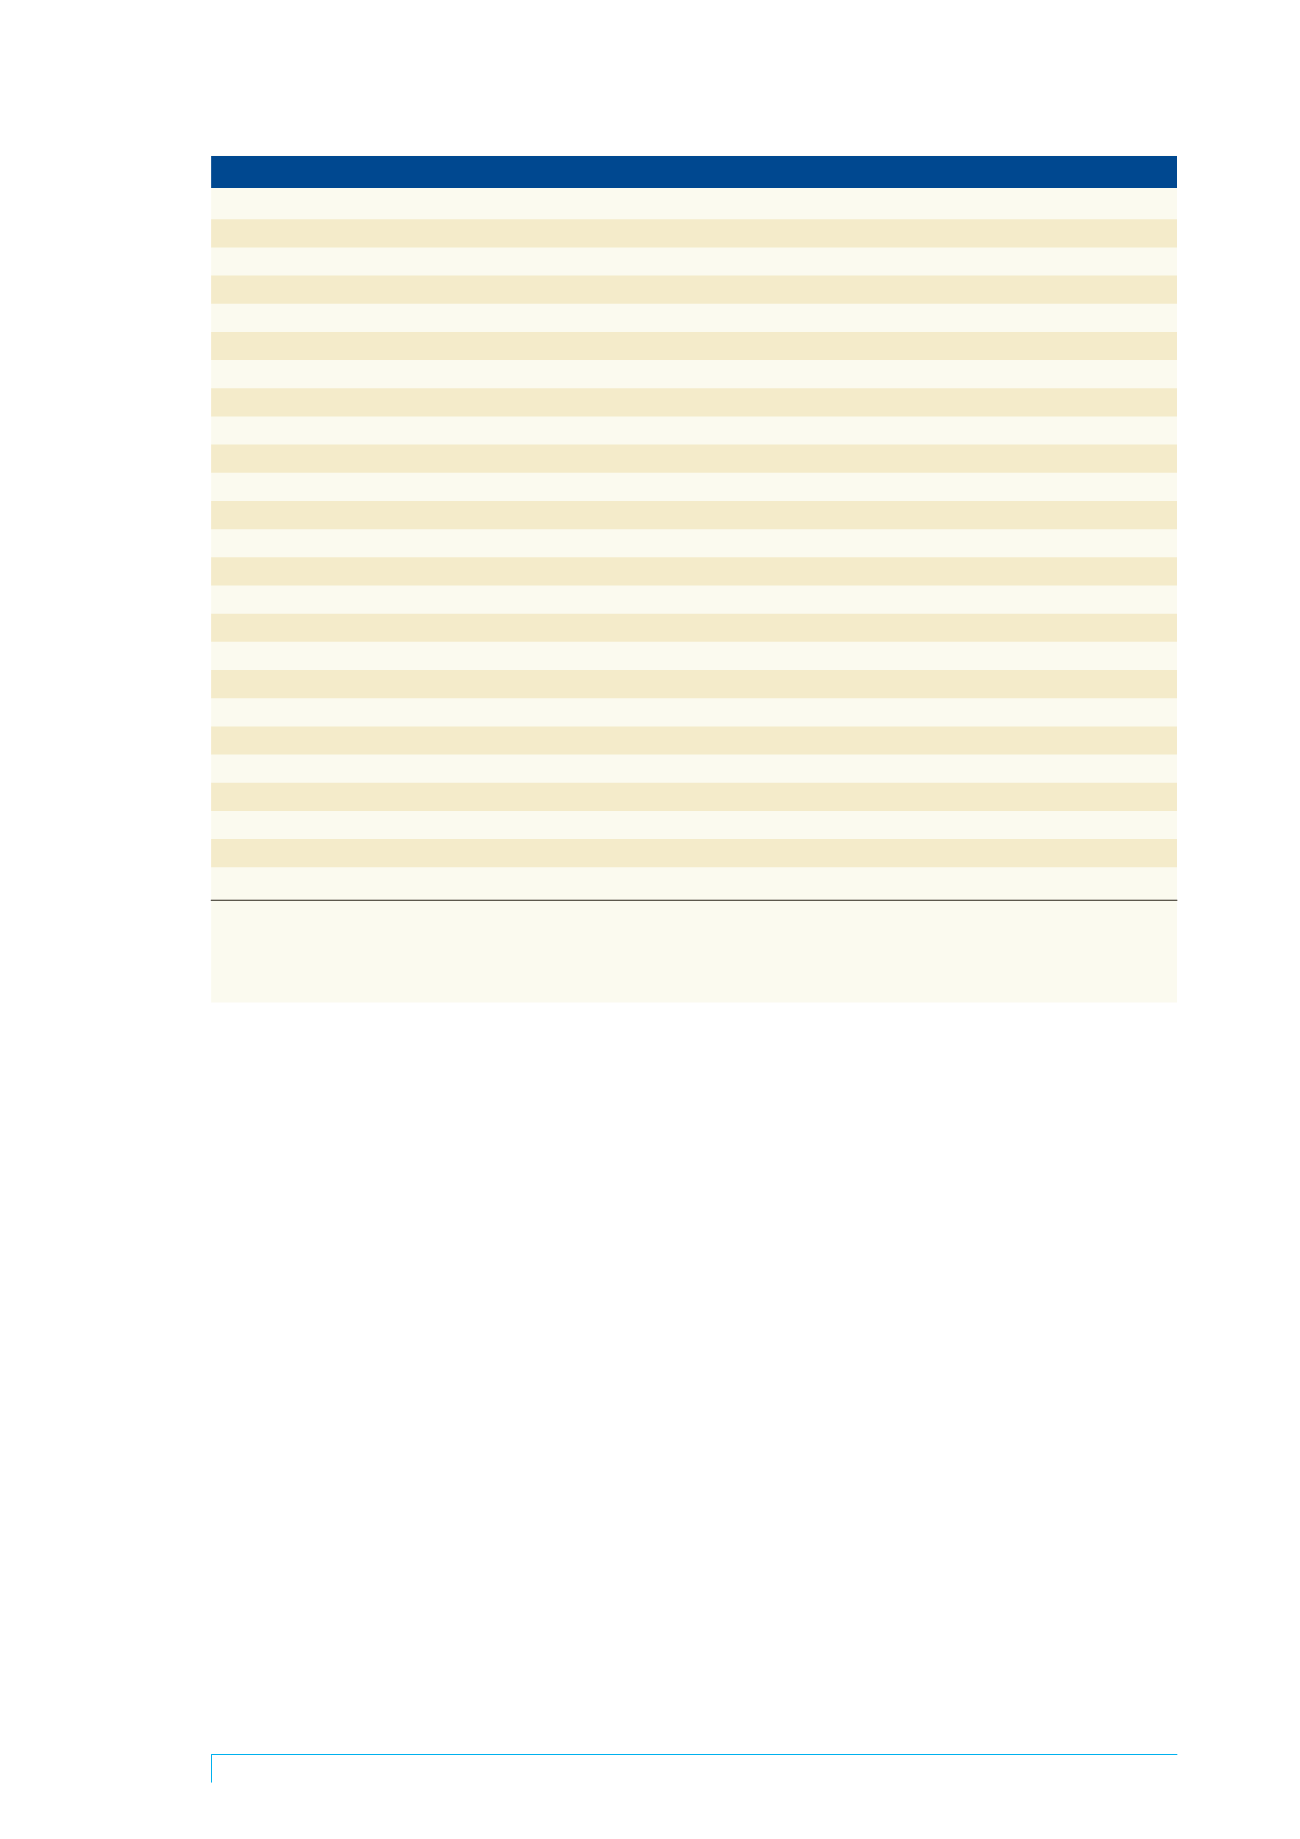
Table 2. The languages other than English spoken by
≥
0.5% of children in each state and territory (n = 4983)
NSW
VIC
ACT
SA
WA
NT
TAS
QLD
n % n % n % n % n % n % n % n %
1. African languages
3 0.9
2. Arabic
43 2.6 28 2.4
4 0.8
3. Assyrian
6 0.5
4. Bengali
11 0.7
1 1.3
5. Cantonese
34 2.4 19 1.6
1 1.3
4 0.8
2 1.2
6. Croatian
1 1.3
7. French
1 1.3
8. German
1 1.3
9. Greek
20 1.2 11 0.9
4 1.1
1 2.2
10. Hindi
11 0.7
8 0.7
1 1.3
11. Italian
12 0.7 15 1.3
1 1.3
3 0.6
5 0.5
12. Macedonian
1 1.3
13. Mandarin
25 1.5 14 1.2
14. Portuguese
3 0.9
15. Russian
1
1.3
16. Samoan
12 0.7
9 0.9
17. Somali
6 0.5
3 0.6
18. Spanish
11 0.7
2 0.6 3 0.6
19. Tamil
8 0.5
1
1.3
20. Turkish
8 0.7
21. Urdu
1 1.3
22. Vietnamese
16 0.9 17 1.4
3 0.9 7 1.4
6 0.6
23. Other
2 2.2
3 0.9
1 2.2
Key: NSW = New South Wales, VIC = Victoria, ACT = Australian Capital Territory, SA = South Australia, WA = Western Australia, NT = Northern
Territory TAS = Tasmania, QLD = Queensland.
Note: Each column represents the number of children within the state/territory who spoke that language and the percentage equals the proportion
of children within that state/territory.