


 19 / 96


A GLOBAL OUTLOOK ON METHANE GAS HYDRATES
19
Sources:WEC(1998), IEA (2012), GEA (2012)
Renewables
Nuclear
Oil
Coal
Coal with CCS
Biomass
Gas
0
250
500
750
1900
1950
2000
2050
Gas with CCS
Coal with
CCS
ExaJoules
1860
0
2
4
6
8
10
Gigatonnes of Carbon
Global CO
2
emission
Global primary energy consumption
1900
1940
1980
2020
2060
time frame (IEA 2011b). A recent report by the U.S. National
Petroleum Council agreed with this assessment, but said that
some portion of the U.S. gas hydrate resource “could be avail-
able for development in the long term, beginning in the 2030-
2050 period…and with the potential for sustained growth over
the remainder of the century” (NPC 2011). It seems reason-
able to extend this conclusion as a conservative view of the
time frame for gas hydrate production in several other na-
tions, particularly Japan, Korea, China, and India, which are
aggressively pursuing gas hydrate research and development.
The recently published Global Energy Assessment report
(GEA 2012) explores possible transformational pathways for
the future global energy system and includes gas hydrates in
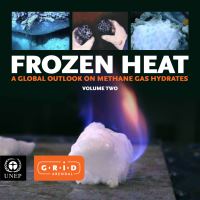
Figure 1.5:
Global primary energy consumption by source. The figure on the left shows historical consumption from 1900 to 2009 and the
GEA scenario’s projections for the period 2010 to 2050. The figure on the right shows global carbon dioxide emissions, both historical
since 1860 and projected. The projections are based on one of three illustrative GEA pathways that were interpreted by two different
modelling frameworks: IMAGE and MESSAGE. This figure shows IMAGE modelling results (IMAGE - GEA_med_450). Sources: WEC
(1998), IEA (2012), GEA (2012).