


 29 / 124


South-North Corridor GRIP 2017 |
29
0%
12%
4%
8%
16%
20%
Estonia
Slovenia
Luxembourg
Sweden
Latvia
Bulgaria
Croatia
Lithuania
Finland
Denmark
Greece
Switzerland
Ireland
Slovakia
Portugal
Austria
Hungary
Czech Republic
Romania
Poland
Belgium
Spain
The Netherlands
France
Italy
United Kingdom
Germany
2014
2015
2014
2015
SNC Region countries
Other EU countries
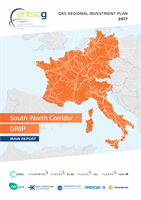
Figure 3.3:
Country-based gas demand in 2014 and 2015 as percentage of total EU demand
(Source: ENTSOG data collection for TYNDP 2017 based on information from TSOs)