


 1 / 131

1
2008 Best Practices Study | Agencies with Revenues Under $1,250,000 | Profile
Agencies with Revenues Under $1,250,000
Appendix
Insurance
Carriers
Technology
Service
Staff Info
Producer
Info
Employee
Overview
Financial
Stability
Revenues/
Expenses
Profile
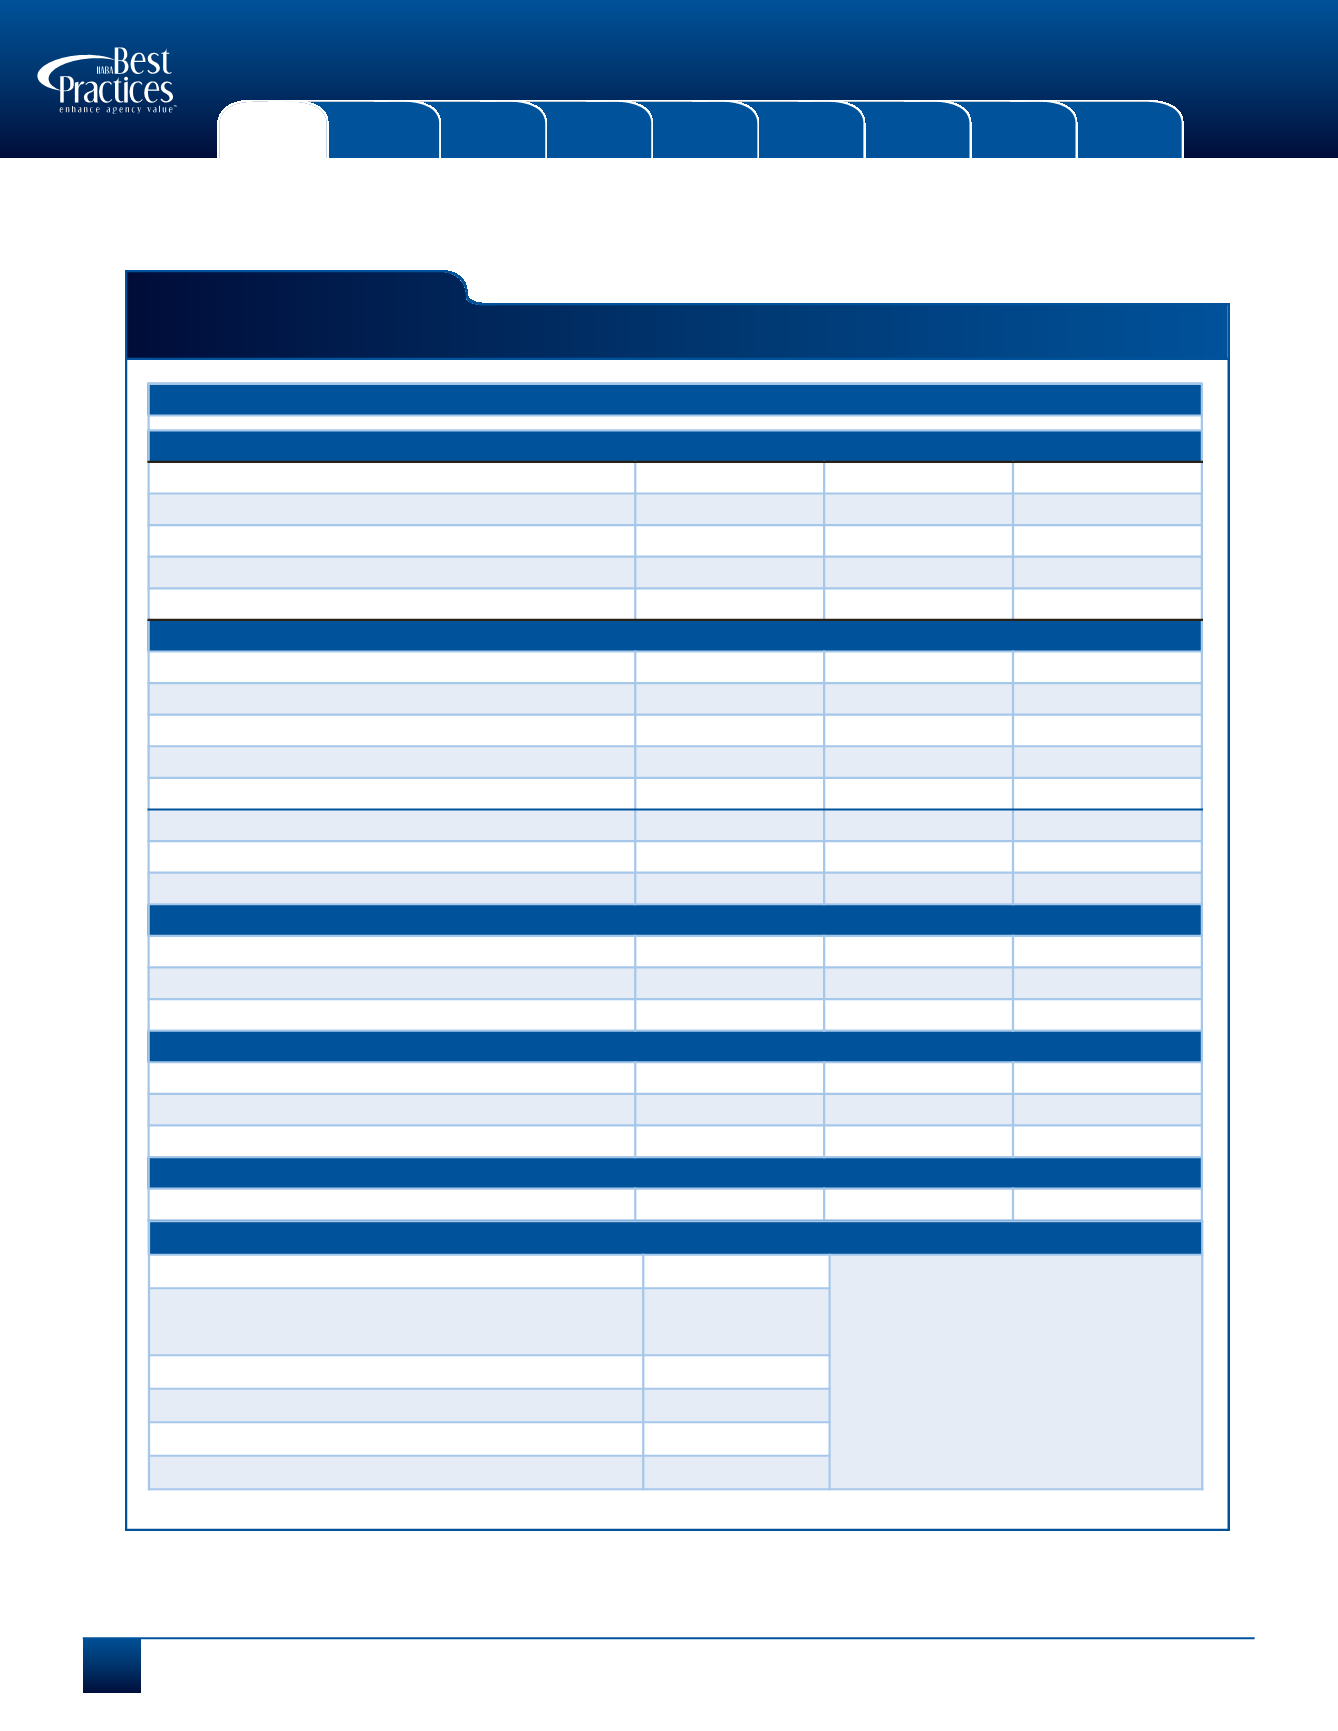
PROFILE
(of Agencies in this Study Group)
A. Average Total Revenues: $717,772
B. Population Density of Metropolitan Areas Where Home Office is Located
Average
+25% Profit
+25% Growth
Less than 50,000
59.4%
52.5%
56.3%
50,000 – 250,000
15.6%
15.0%
12.5%
250,000 – 1,000,000
15.6%
20.0%
20.8%
More than 1,000,000
9.4%
12.5%
10.4%
C. Corporate Structure
C
31.3%
25.0%
25.0%
S
56.3%
62.5%
62.5%
Partnership
0.0%
0.0%
0.0%
LLC
6.3%
7.5%
6.3%
Sole Proprietorship
6.3%
5.0%
6.3%
Total # Agency locations
1.1
1.1
1.0
Agency has an ESOP
0.0%
0.0%
0.0%
% of Stock Owned by ESOP
N/A
N/A
N/A
D. Shareholders
Number of Shareholders
(excluding ESOP)
1.8
2.1
2.0
High
6.0
Low
1.0
E. Ownership Percentage
% Owned by Largest Shareholder
(excluding ESOP)
78.6%
74.6%
76.2%
High
100.0%
Low
46.0%
F. Shareholder Age
Current Age of Largest Shareholder
52.9
53.0
60.9
G. Parent Corporation
“Other” includes AAA,
joint venture, and another
insurance agency.
Agency is Owned by Another Corporation
0.0%
Description of Parent Corporation
Financial Institution
0.0%
National Broker
0.0%
Other
0.0%