


 7 / 131

7
2008 Best Practices Study | Agencies with Revenues Under $1,250,000 | Revenues/Expenses
Agencies with Revenues Under $1,250,000
Appendix
Insurance
Carriers
Technology
Service
Staff Info
Producer
Info
Employee
Overview
Financial
Stability
Revenues/
Expenses
Profile
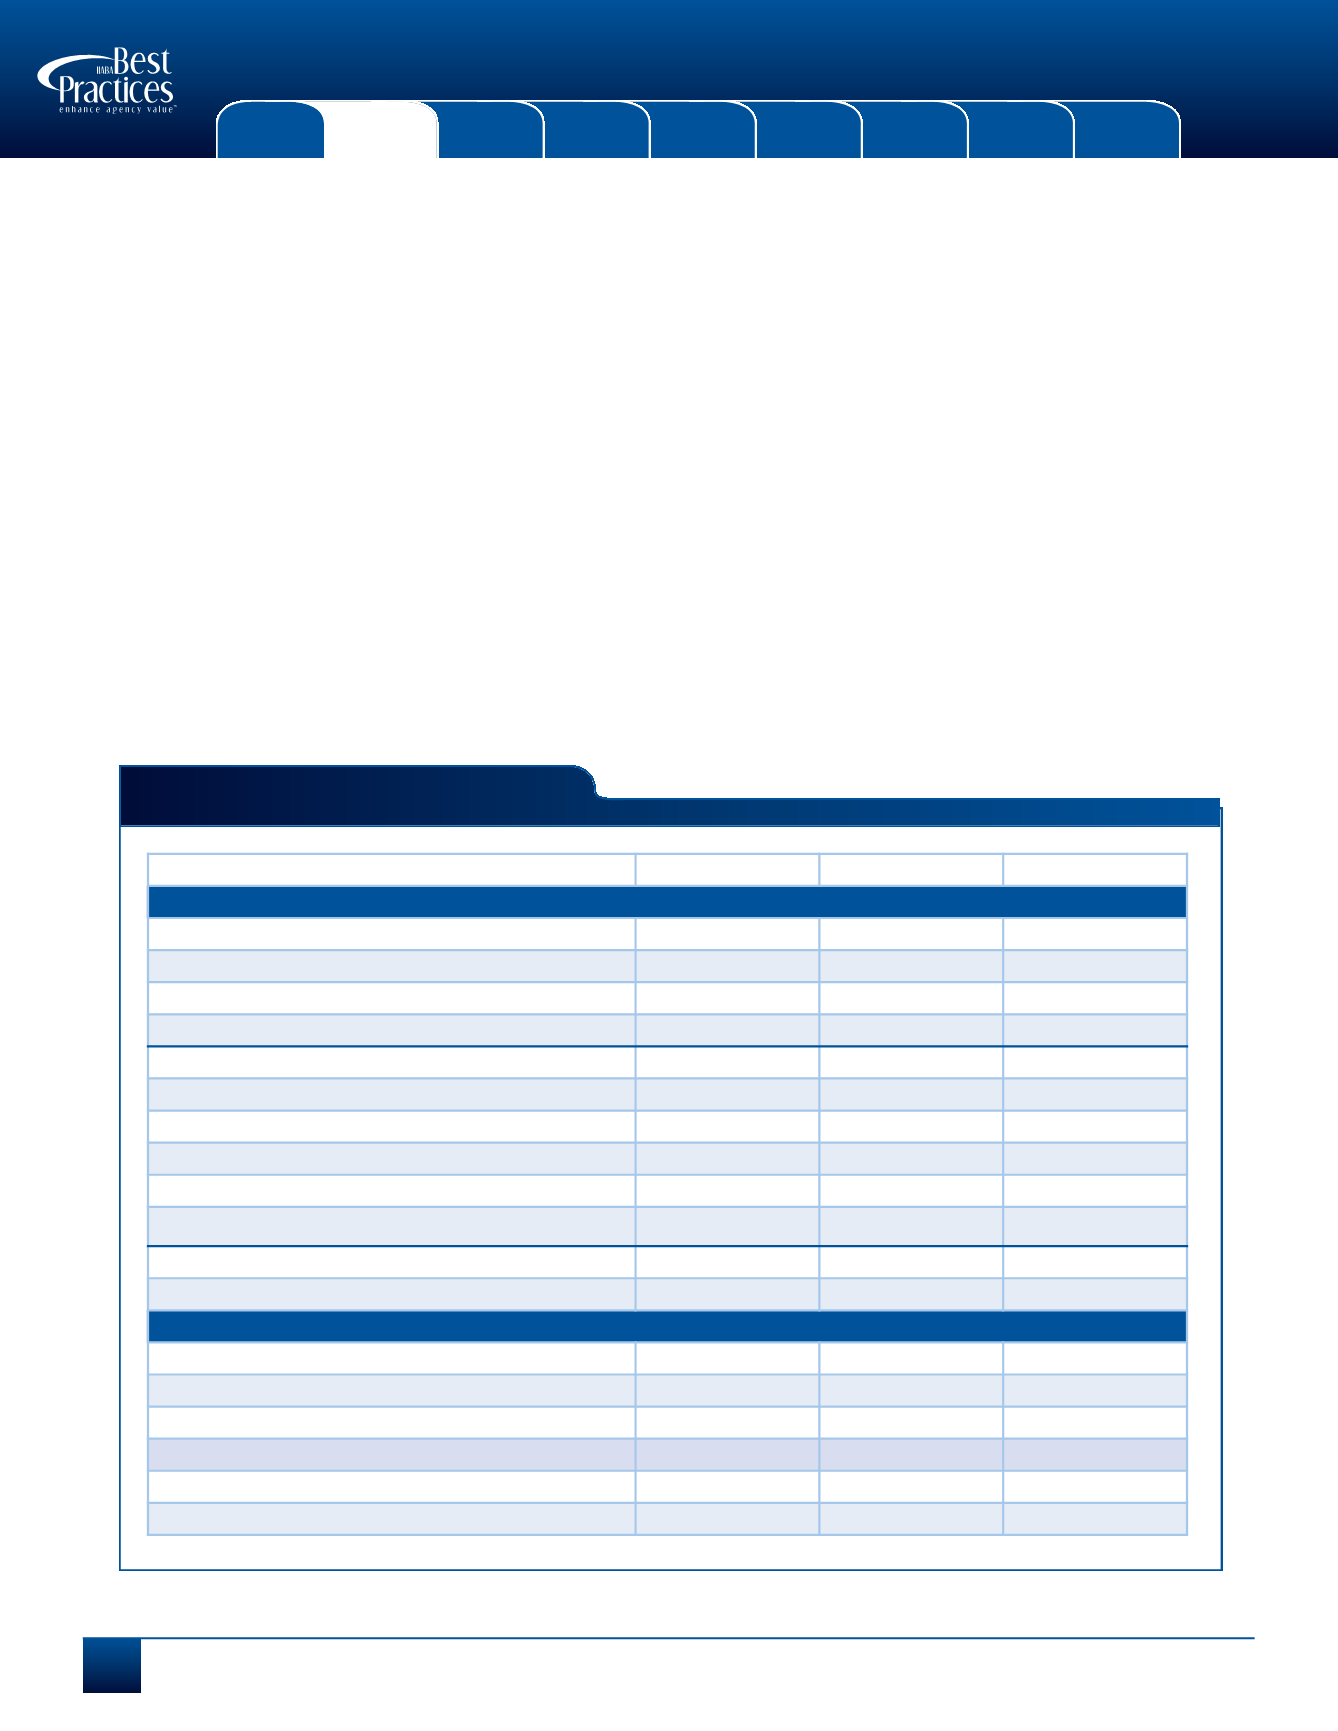
Expenses
(as % of Net Revenues)
Breakdown of Expenses — What This Means to You
In the past the study has consolidated revenues and expenses into fairly broad categories making some comparisons difficult.
Factors such as corporate structure (e.g., C corporation versus S corporation) further complicated expense comparisons because
of what was or was not reflected on the income statement. The study now provides greater detail for both revenues and
expenses which has resulted in more meaningful benchmarks for better “apples-to-apples” comparisons. The new expense
breakdowns include:
Compensation Expense – Both Payroll and Benefits have been broken down to provide a better understanding of the
participating agencies’ costs – what costs are somewhat fixed (payroll taxes) versus discretionary costs (retirement benefits,
insurance, etc.).
Selling & Operating Expense –These expense categories now include greater detail, including any depreciation and
amortization expense associated with the category. This allows for a more accurate picture of the total expenses incurred as
both cash (e.g. monthly lease payment) and non-cash expenses (e.g. computer depreciation expense) are captured.
Average
+25% Profit
+25% Growth
Compensation Expenses
Payroll
Employee
43.8%
37.3%
41.0%
“Non-Employee” Producers
3.1%
2.8%
2.0%
Temporary Help
0.1%
0.0%
0.0%
Total Payroll
46.9%
40.1%
43.2%
Benefits
Payroll Taxes
3.8%
2.9%
3.5%
Retirement
2.7%
2.7%
3.1%
Insurance
3.4%
1.6%
1.5%
Other
0.0%
0.1%
0.0%
Total Benefits
9.9%
7.3%
8.1%
Total Compensation
56.9%
47.3%
51.3%
Selling Expenses
T&E/Conventions
1.2%
0.9%
0.8%
Auto Expenditures
2.1%
2.5%
1.5%
Auto Depreciation
0.6%
0.3%
1.4%
Total Auto
2.7%
2.8%
2.9%
Advertising/Promotions
2.4%
1.8%
2.1%
Total Selling
6.3%
5.4%
5.7%