


 145 / 232

Ten Year Network Development Plan 2015 |
145
0
1,200
1,000
800
600
400
200
GWh/d
2015
Low High Low High Low High Low High
2020
2025
2030
2035
DC
2W
Green Scenario
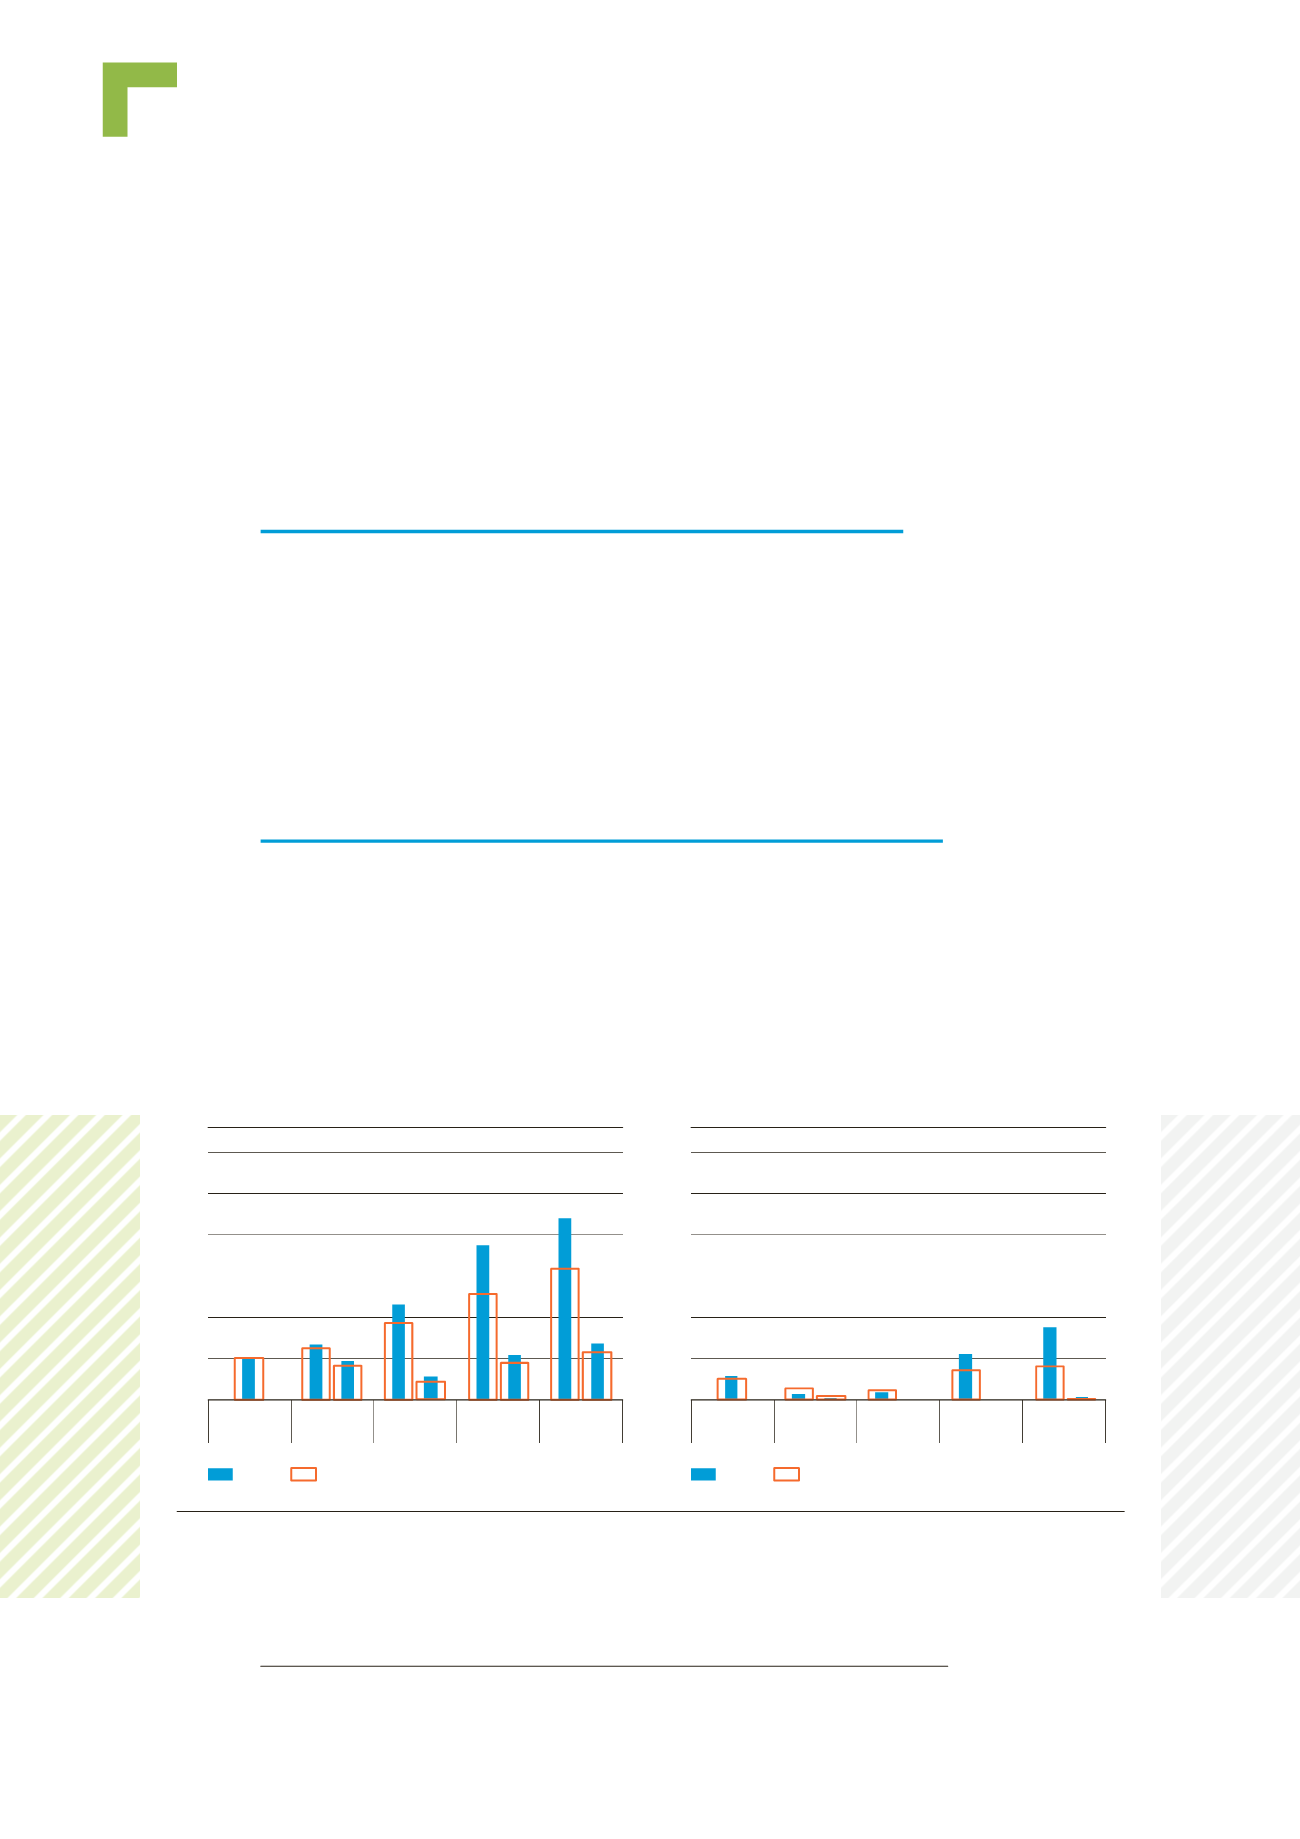
Figure 6.11:
Disrupted demand (daily value) on the peak day and 2-week Uniform Risk average day.
Green scenario (left) and Grey scenario (right)
0
1,200
1,000
800
600
400
200
GWh/d
2015
Low High Low High Low High Low High
2020
2025
2030
2035
DC
2W
Grey Scenario
6.3 Infrastructure resilience
This part of the assessment carried out by ENTSOG
focuses on the ability of the European gas system
to meet the supply demand balance under stressed
situations. Such stress can result from climatic
conditions (higher demand) or supply unavailability
(source or infrastructure).
6.3.1 DISRUPTED DEMAND AND REMAINING FLEXIBILITY
Unlike previous TYNDPs, the Report does not identify which projects might directly
mitigate the risks of demand disruption or low Remaining Flexibility. This change
results from the new role of the TYNDP which is the basis for the selection of Project
of Common Interest. The Report should not define the benefits of a project under a
single criterion and the project specific assessment, defined by the TEN-E Regula-
tion, will cover multiple criteria for assessing each candidate Project of Common
Interest.
6.3.1.1 Evolution of demand disruption at aggregated European level
The following graphs show the disrupted demand under the two peak situations con-
sidered (1-day Design Case and 2-week Uniform Risk) at the aggregated European
level for each Global Context. The level of disruption is directly influenced by the as-
sumed eighty percent UGS deliverability under periods of high daily demand. Since
2007
1)
, storage has always had a sufficient volume in February to ensure a ninety
percent deliverability rate with the exception of the February 2012 cold spell, when
the withdrawal rate was limited to seventy percent.
1) This date refers to the start date of historical data on AGSI+ platform of GSE