


 II / 158

KEY FIGURES
ANNUAL REPORT 2016 – BOSKALIS
KEY FIGURES
SHARE INFORMATION
2016
2015
(Share price in EUR)
High
37.60
49.21
Low
27.89
35.70
Close
32.99
37.63
Average daily trading volume
492,459
468,176
Number of issued ordinary shares at year-end (x 1,000)
130,077
125,627
Average number of outstanding shares (x 1,000)
128,205
124,182
Stock market capitalization (in EUR billion)
4.291
4.727
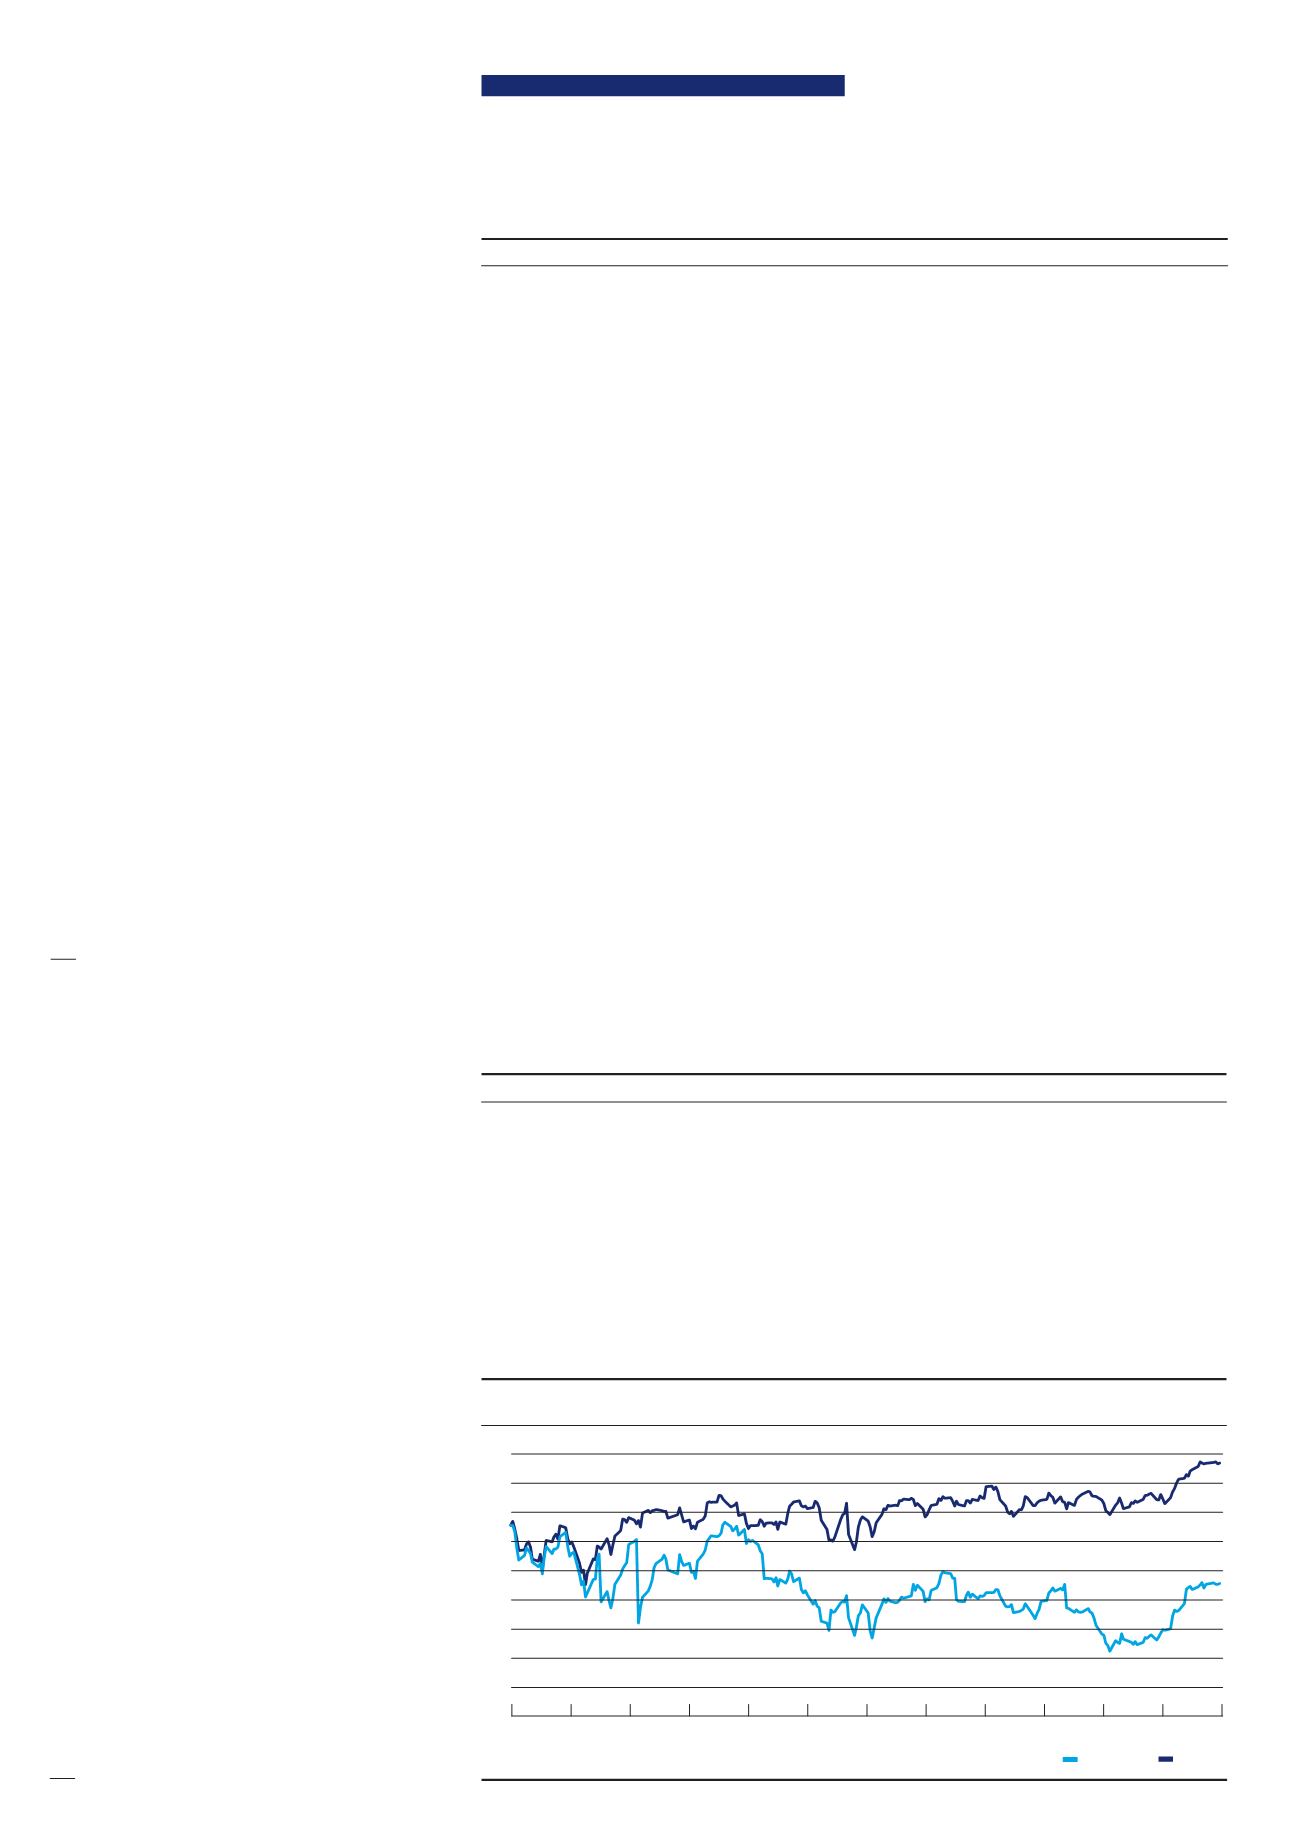
Boskalis AEX
DEVELOPMENT BOSKALIS SHARE PRICE 2016,
AEX-INDEX REBASED TO BOSKALIS
(in EUR)
JAN FEB MAR APR MAY JUN JUL
AUG SEP OCT NOV DEC
24
26
28
30
32
34
36
38
40
42
(in EUR million, unless stated otherwise)
2016
2015
Revenue
2,596
3,240
Order book
2,924
2,490
EBITDA
660.5*
884.7
Net result from joint ventures and associates
11.3*
43.3
Depreciation and amortization
277.2
278.6
Operating result
384.6
577.3
Impairments
842.6
14.5
EBIT
-458.1
562.8
Net profit
276.4*
440.2
Net profit/loss
-563.7
440.2
Net group profit/loss
-561.8
443.5
Cash flow
464.0
765.4
Shareholders’ equity
3,121
3,714
Personnel (headcount)
6,960
8,268
RATIOS (IN PERCENTAGES)
EBIT as % of revenue
14.8*
17.4
Return on capital employed
9.1*
10.8
Return on equity
8.1*
12.8
Solvency
56.1
56.3
FIGURES PER SHARE (IN EUR)
Profit
2.16*
3.54
Dividend
1.00
1.60
Cash flow
3.62
6.16
* Excluding impairments