


 III / 158

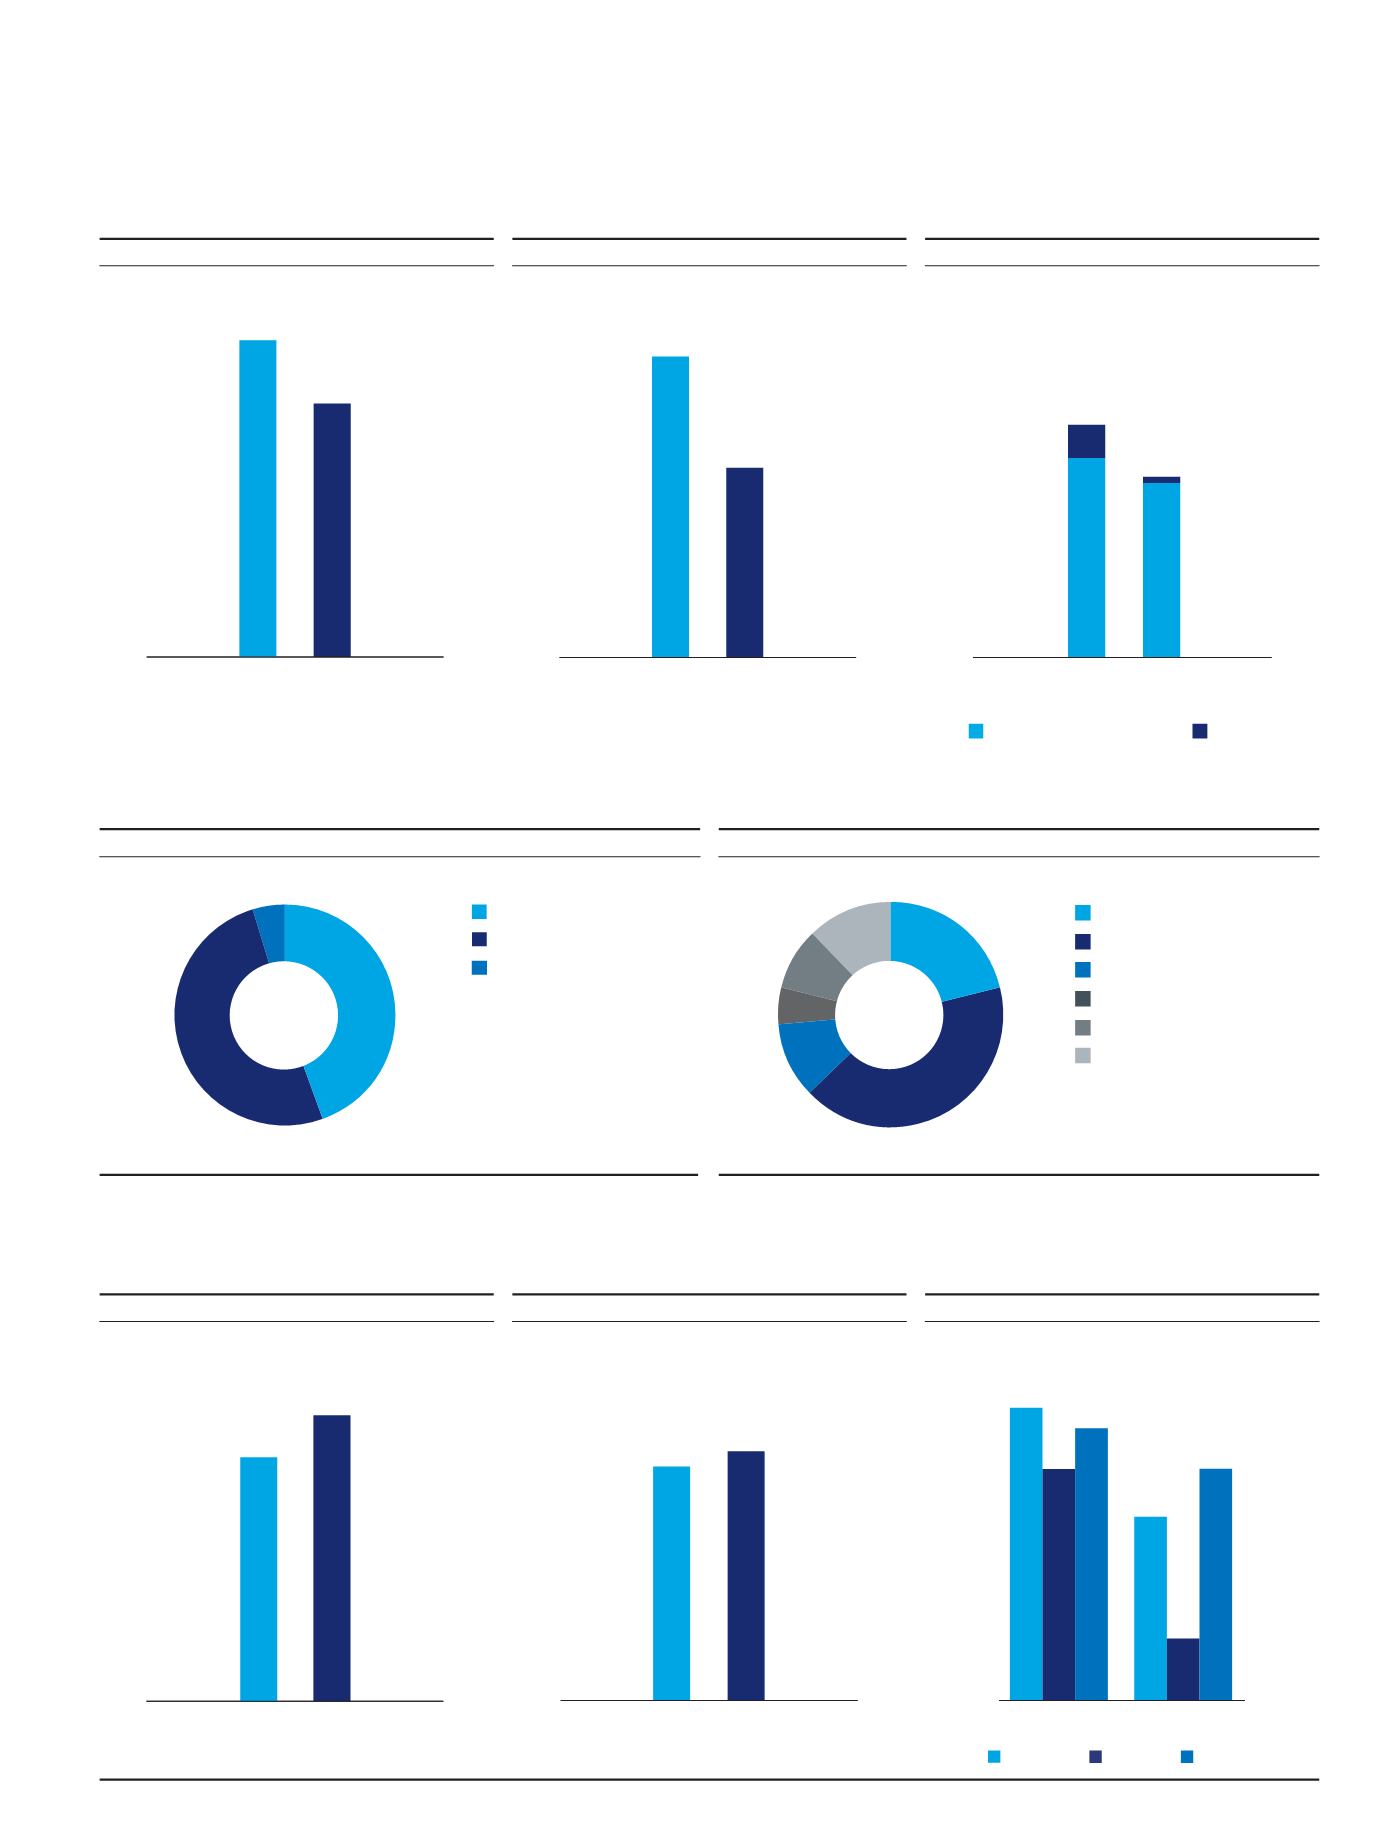
REVENUE BY SEGMENT
(in EUR million)
REVENUE BY GEOGRAPHICAL AREA
(in EUR million)
2015 2016
2,596
3,240
2015 2016
*
276.4
440.2
2015 2016
203
27
177
5
2015 2016
2,490
2,924
2015
2016
43
34
40
27
9
34
2015 2016
2,394
2,543
REVENUE
(in EUR million)
NET PROFIT
(in EUR million)
CAPITAL EXPENDITURE
(in EUR million)
Disposals
Net capital expenditure
ORDER BOOK
(in EUR million)
ACQUIRED ORDERS
(in EUR million)
FLEET UTILIZATION
(in weeks per year)
Cutters
HTVs
Hoppers
552
1,079
284
135
233
315
North and South
America
Africa
Middle East
Australia / Asia
Rest of Europe
The Netherlands
Dredging & Inland Infra
Offshore Energy
Towage & Salvage
Eliminations (-23)
1,164
1,334
121