


 6 / 8
6 / 8

WHEN — Q3 2014
Dayton Parts LLC
(continued from page 5)
6
continued on page 7
0
0.00
0.10
0.20
0.30
0.40
0.50
0.60
0.70
0.80
10
20
Retardation Ratio
Line Pressure (psi)
30
40
50
60
70
80
90
100
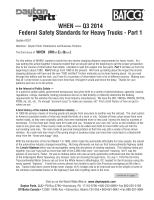
Dayton Parts DP23 Friction Material
0.050
0.128
0.120
0.191
0.180
0.277
0.250
0.344
0.310
0.400
0.370
0.481
0.410
0.538
Actual Wheel Load (lb) — 11451.7
2
Actual Inertia (slug/ft ) — 950
Brake Type — Meritor Drive
Rolling Radius (in) — 19.6
Slack Adjuster — Haldex 5.5"
Air Chamber — MGM 3030
Brake Drum — Webb 66864
FMVSS-121 Minimum
Retardation Ratio
Baseline Pass/Fail
Link Testing Laboratories, Inc.
Brake Effectiveness
That’s an 18.4% ((1,051/1,288)-1) difference in the amount of brake force with just a change in tire size. Conversely if
you were to take off 22.5" tires and replace them with 24.5" (maybe looking for better fuel economy) you would also
reduce the amount of brake force accordingly at the pavement.
For 4707 block the set-up would most likely be a type 30 chamber, 5.5" slack arm length and again a 19.5 SLR for an
11.00R22.5 tire. Since 4707 can be used on a drive or trailer axle, the drive axle set-up with the lower AL factor (slack
arm length x air chamber type) is a more accurate test. Whenever you see test results for block that can be used on a
drive or trailer axle (4515, 4707) using a 6.0" slack arm like on a typical trailer brake set-up understand that’s
“enhancing”
the results somewhat.
Brake Effectiveness
- After a specified burnishing procedure, which we won’t go into detail here, this part of the test
is done with the drum temperature between 150 and 200 degrees. The brake assembly is brought to a speed of
50 mph and then a stop is conducted with a constant air chamber pressure of 20 psi. The average torque exerted by
the brake is measured from the time the specified air pressure is reached until the brake stops. This torque value is
then divided by the (SLR x WL) to determine the retardation ratio (remember this when we get to RP628 in Part 2).
The drum is then brought back to the 150 to 200 degree temperature range and the test is repeated 6 more times,
while increasing the air pressure in 10 psi intervals up to and including 80 psi.
Here’s a typical brake effectiveness graph plotting the test results —
This part of the test is to confirm that the friction material can generate a sufficient amount of brake torque throughout
the pressure range of the air chamber when high temperature is not a factor. The line you see starting at .050 and
ending at 0.41 is the minimum baseline for compliance as set by FMVSS-121. In other words it’s simply a pass or fail.
The result of this part of the overall test in no way determines whether a friction material is
“economy”
or
“premium”
and so forth. However a higher retardation ratio would indicate a higher COF.