


 7 / 8
7 / 8

WHEN — Q3 2014
Dayton Parts LLC
(continued from page 6)
7
continued on page 8
0
10
20
30
40
50
60
70
80
90
100
110
120
1 2
Pressure (psi)
Power Stops
3 4 5 6 7 8 9 10
0
100
200
300
400
500
600
700
800
900
1000
1100
1200
Initial Lining Temp (Deg °F)
Actual Wheel Load (lb) — 11451.7
2
Actual Inertia (slug/ft ) — 950
Brake Type — Meritor Drive
Rolling Radius (in) — 19.6
Slack Adjuster — Haldex 5.5"
Air Chamber — MGM 3030
Brake Drum — Webb 66864
Dayton Parts
DP23 Friction Material
Link Testing Laboratories, Inc.
Brake Power
Drum
Temperature
Air Pressure
Brake Recovery
– Two minutes after the hot stop is completed the brake assembly must make 20 consecutive stops
2
from 30 mph to 0 mph at a deceleration rate of 12ft/sec . The stops are at equal intervals of 60 seconds from the
beginning of one stop to the beginning of the next until all 20 stops are completed. During this part of the test air line
2
pressure and drum temperature are recorded. The air line pressure needed to achieve the 12ft/sec deceleration rate
cannot exceed 85 psi nor be less than 20 psi. Drum temperatures will usually hover between 400 and 450 degrees
and may begin to slowly drop.
(see the chart on the next page.)
This part of the test tells us if the friction material can
continue to create sufficient torque as the brake
temperature rises. A rise in air line pressure is normal
as this
“fade”
warns the driver that his brakes are
getting hotter because he has to apply more air
pressure to achieve the same amount of braking
power. The max air pressure allowed is set at 100 psi
because air governors are set to
“cut-out”
at 105 psi
and therefore the air system’s max pressure available.
Hot Stop
– One minute after the last deceleration is
completed for the brake power test the drum is
brought to a speed of 20 mph and a complete stop is
2
made at a deceleration rate of 14ft/sec . Air line
pressure and drum temperature are again recorded.
Another side note here (again). When comparing two different friction materials, if you don’t know the actual COF of
each one, you could substitute this ratio value in place of the COF when using the brake force formula. Granted it’s not
the actual COF but for comparison purposes it would illustrate the difference between the two materials. Just make
sure you use the retardation ratio from the same psi application (say like at 40 psi) for both materials so you’re
making an
“apples to apples”
comparison.
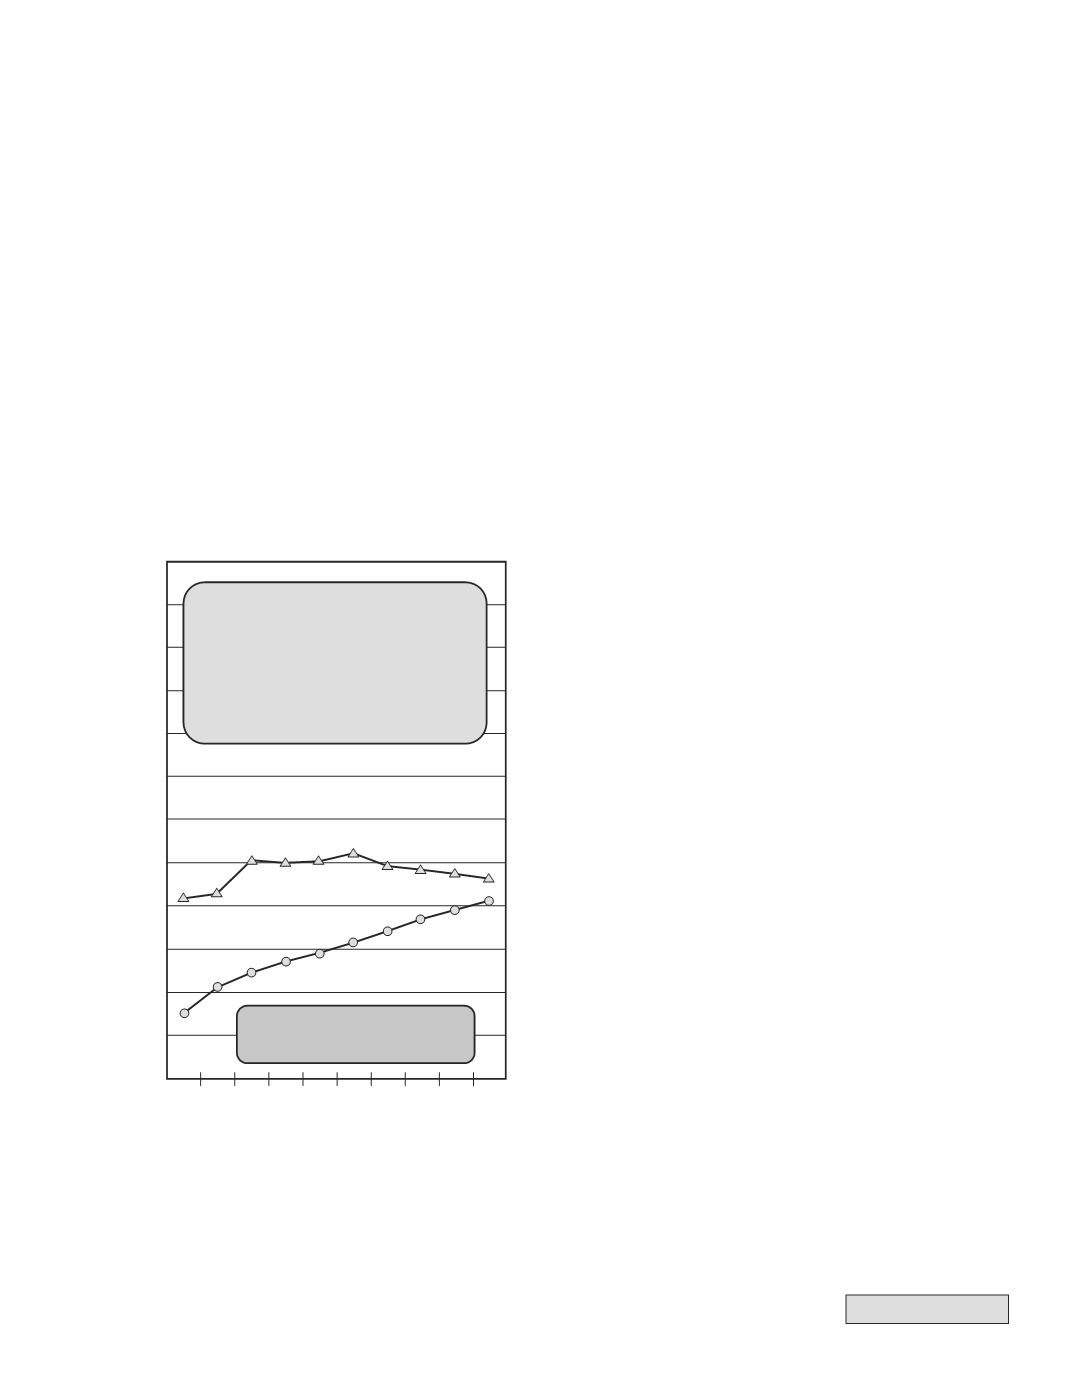
Brake Power
– This part of the test also starts with the drum temperature at 150 to 200 degrees. The brake assembly
2
makes a series of 10 consecutive stops from 50 mph to 15 mph at a deceleration rate of 9ft/sec . Upon reaching
15 mph the brake is released and the assembly accelerates back to 50 mph. 72 seconds after the start of the first
deceleration the brake is applied again in the same fashion for the second stop and so on until all 10 stops are
completed. During this test the air line pressure and drum temperature are recorded. The air line pressure cannot
exceed 100 psi during any deceleration. Temperature is also recorded but is not part of the test criteria. Generally the
th
drum temperature will rise to between 400 and 450 degrees by the 10 stop. In comparison to the original FMSI/SAE
J661 test, the second letter code for the hot stop COF was taken at a drum temperature between 400 and 650 degrees.
Here’s what a typical brake power graph looks like.