


 76 / 88

ECONOMIC REPORT 2015
76
Greenhouse Gas Emission Reduction Efforts in
UK Upstream
In 2014, the UK upstream industry, comprising 100
offshore installations and 26 onshore terminals within
the ETS scheme, emitted 14.7 million tonnes of CO
2
equivalent (mainly CO
2
and methane), amounting to
about three per cent of the UK’s total GHG emissions.
Most of the emissions come from combustion of fuels,
usually natural gas, for electricity generation and
compression and from flaring and venting of gas, usually
for safety reasons. According to the International
Association of Oil & Gas Producers (IOGP), energy
consumption and gas flaring is lower in the UK and
the rest of Europe than in other oil and gas-producing
regions of the world. This is due to the comprehensive
environmental and safety regulations that govern all
UKCS operations.
Total GHG emissions from upstream installations in the
ETS have fallen steadily from 18.4 million tonnes in 2008
to 14.7 million tonnes in 2014. A longer time series from
the national GHG inventory shows a steady decline in
emissions between 1996 and 2014, amounting to
37 per cent over this period. This reflects not only the
decline in production and decommissioning of some
older fields and installations, but also the efforts by
operators to minimise all avoidable emissions and to
improve energy efficiency and emissions intensity.
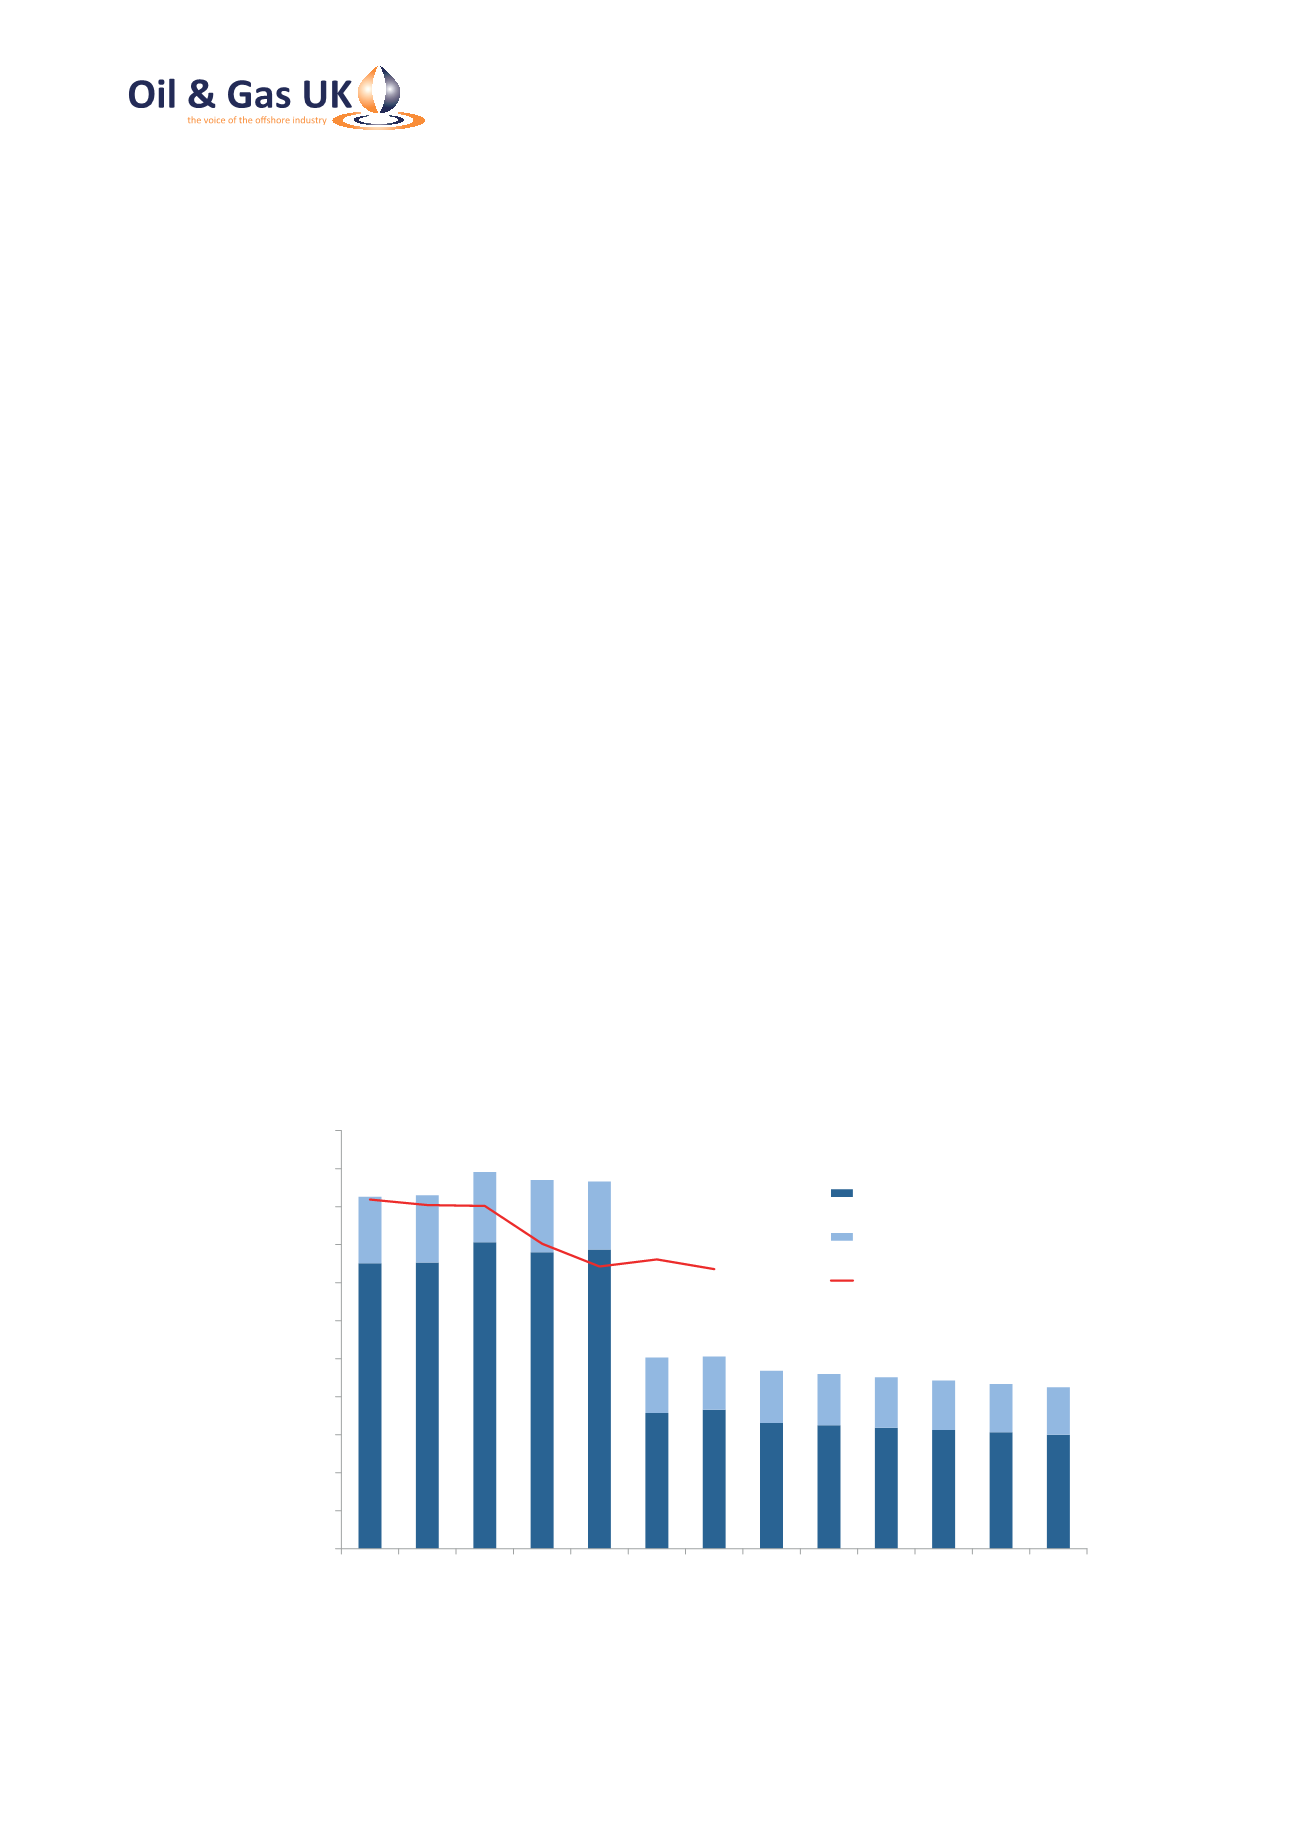
As Figure 50 shows, the sector received free allowances
in excess of its verified emissions within Phase II of the
ETS. In Phase III, the allocation of free allowances to
the UK upstream was almost halved. The UK upstream
suffered a more severe reduction in 2013 than most
other energy-intensive industrial sectors because it
was decided that electricity generation should not be
eligible for any free allowances in Phase III. Although
perhaps justified for onshore generation, this represents
an anomaly offshore where electricity generation
accounts for 35 to 40 per cent of total GHG emissions
and operators do not have access to the onshore grid.
In 2014, the entire sector received free allowances for
ten million tonnes of CO
2
, representing 69 per cent of
total verified emissions. The shortfall is expected to
rise gradually from 2015 to 2020. Furthermore, unless
the ineligibility of emissions from offshore electricity
generation is corrected in Phase IV of the ETS (2021 to
2030), the higher expected carbon price will make the
UKCS more vulnerable to international competition and
carbon leakage in the future and will create additional
barriers to new field developments.
0
2
4
6
8
10
12
14
16
18
20
22
2008
2010
2012
2014
2016
2018
2020
Million Tonnes CO
2
e
Allowances Offshore
Allowances Onshore
Total GHG Emissions
Source: Directorate - General Climate Action - European Commission
Figure 50: UKCS Faces Growing Carbon Exposure in ETS Phase III