


 10 / 56

HEALTH & SAFETY REPORT
2015
page 10
4. Safety Performance
This section outlines key aspects of the UK offshore oil and gas industry’s safety performance using a number
of metrics and a range of reference sources. Please note that the data sets cover different periods and, where
appropriate and feasible, the individual charts below stipulate the relevant reporting period.
4.1 Oil & Gas UK Benchmarking
Each year, Oil & Gas UK carries out a benchmarking exercise for participating installation duty holders, as listed in
Figure 3 below, to gain an overview of the UK industry’s safety performance. This is conducted on an anonymous
basis with companies allocated a letter as illustrated in Figure 5 opposite. Each participating company receives
their individual company results, which are issued to their representative on Oil & Gas UK’s Health & Safety Forum.
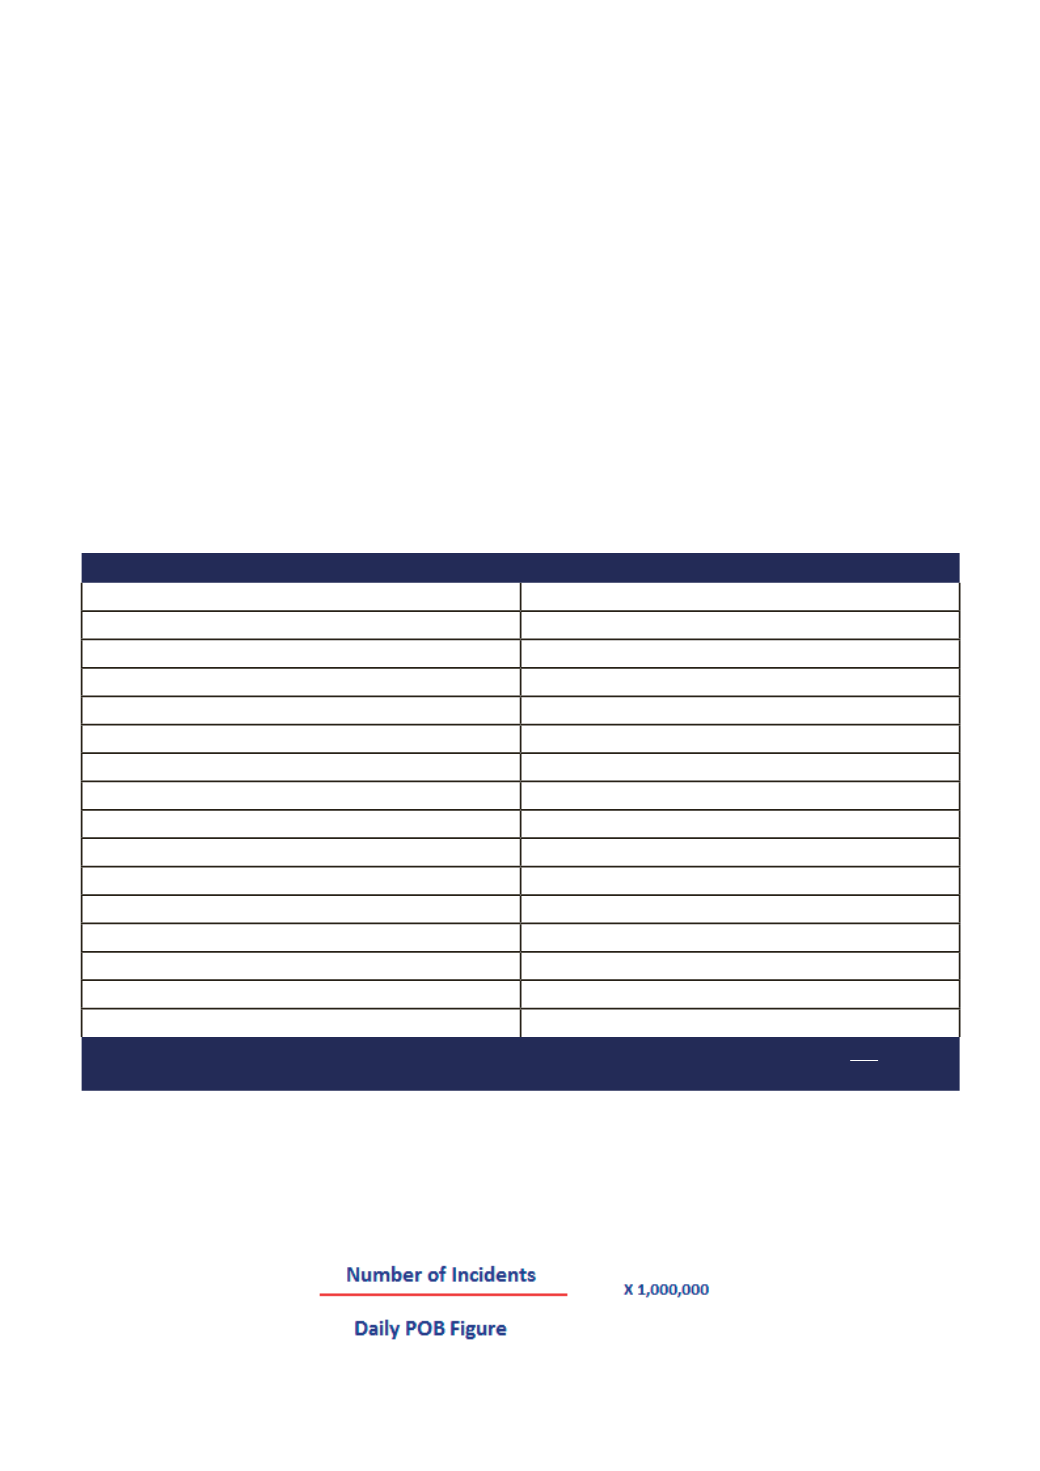
Figure 3: Companies Participating in the Benchmarking Exercise
Participating Companies
Apache North Sea Ltd
GDF Suez E&P UK Ltd
BG Group Plc
Maersk FPSO UK Ltd
Bluewater Services UK Limited
Maersk Oil North Sea UK Ltd
BP Exploration Operating Company Ltd
Marathon Oil UK Ltd
Britannia Operator Ltd
Nexen
BW Offshore UK
Perenco UK Limited
Centrica Energy Upstream
Petrofac Facilities Management Ltd
Centrica Storage Ltd
Premier Oil UK Limited
Chevron North Sea Ltd
RWE Dea UK Ltd
CNR International UK Ltd
Shell UK Limited
ConocoPhillips UK Ltd
Talisman-Sinopec Energy UK Ltd
Dana Petroleum Plc
TAQA Bratani Limited
ENI Liverpool Bay Operating Company
Teekay Petrojarl
EnQuest Plc
Total E&P UK Limited
E.ONE&P UK Limited
Wood Group PSN Ltd
Fairfield Energy Ltd
N.B. It is important to note that companies are listed above in alphabetical order and this does not
correspond to letters allocated to companies in the performance charts in Figure 5.
The benchmarking uses incident data from the Health and Safety Executive (HSE) and man-hour data from the
Vantage Personnel on Board (POB) tracking system, covering a calendar-year period. The injury rates are then
calculated per million man-hours based on a 12-hour workday as illustrated in Figure 4 below.
Figure 4: Oil & Gas UK’s Safety Performance Benchmarking Calculations