


 11 / 56

page 11
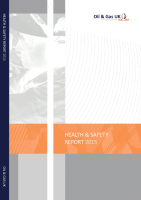
The benchmarking process covers: reportable injuries frequencies (fatal, specified and over-seven-day injuries)
and reportable dangerous occurrence frequencies, according to the
Reporting of Injuries Diseases and Dangerous
Occurrence Regulations (RIDDOR) 2013
. See Figure 5 below.
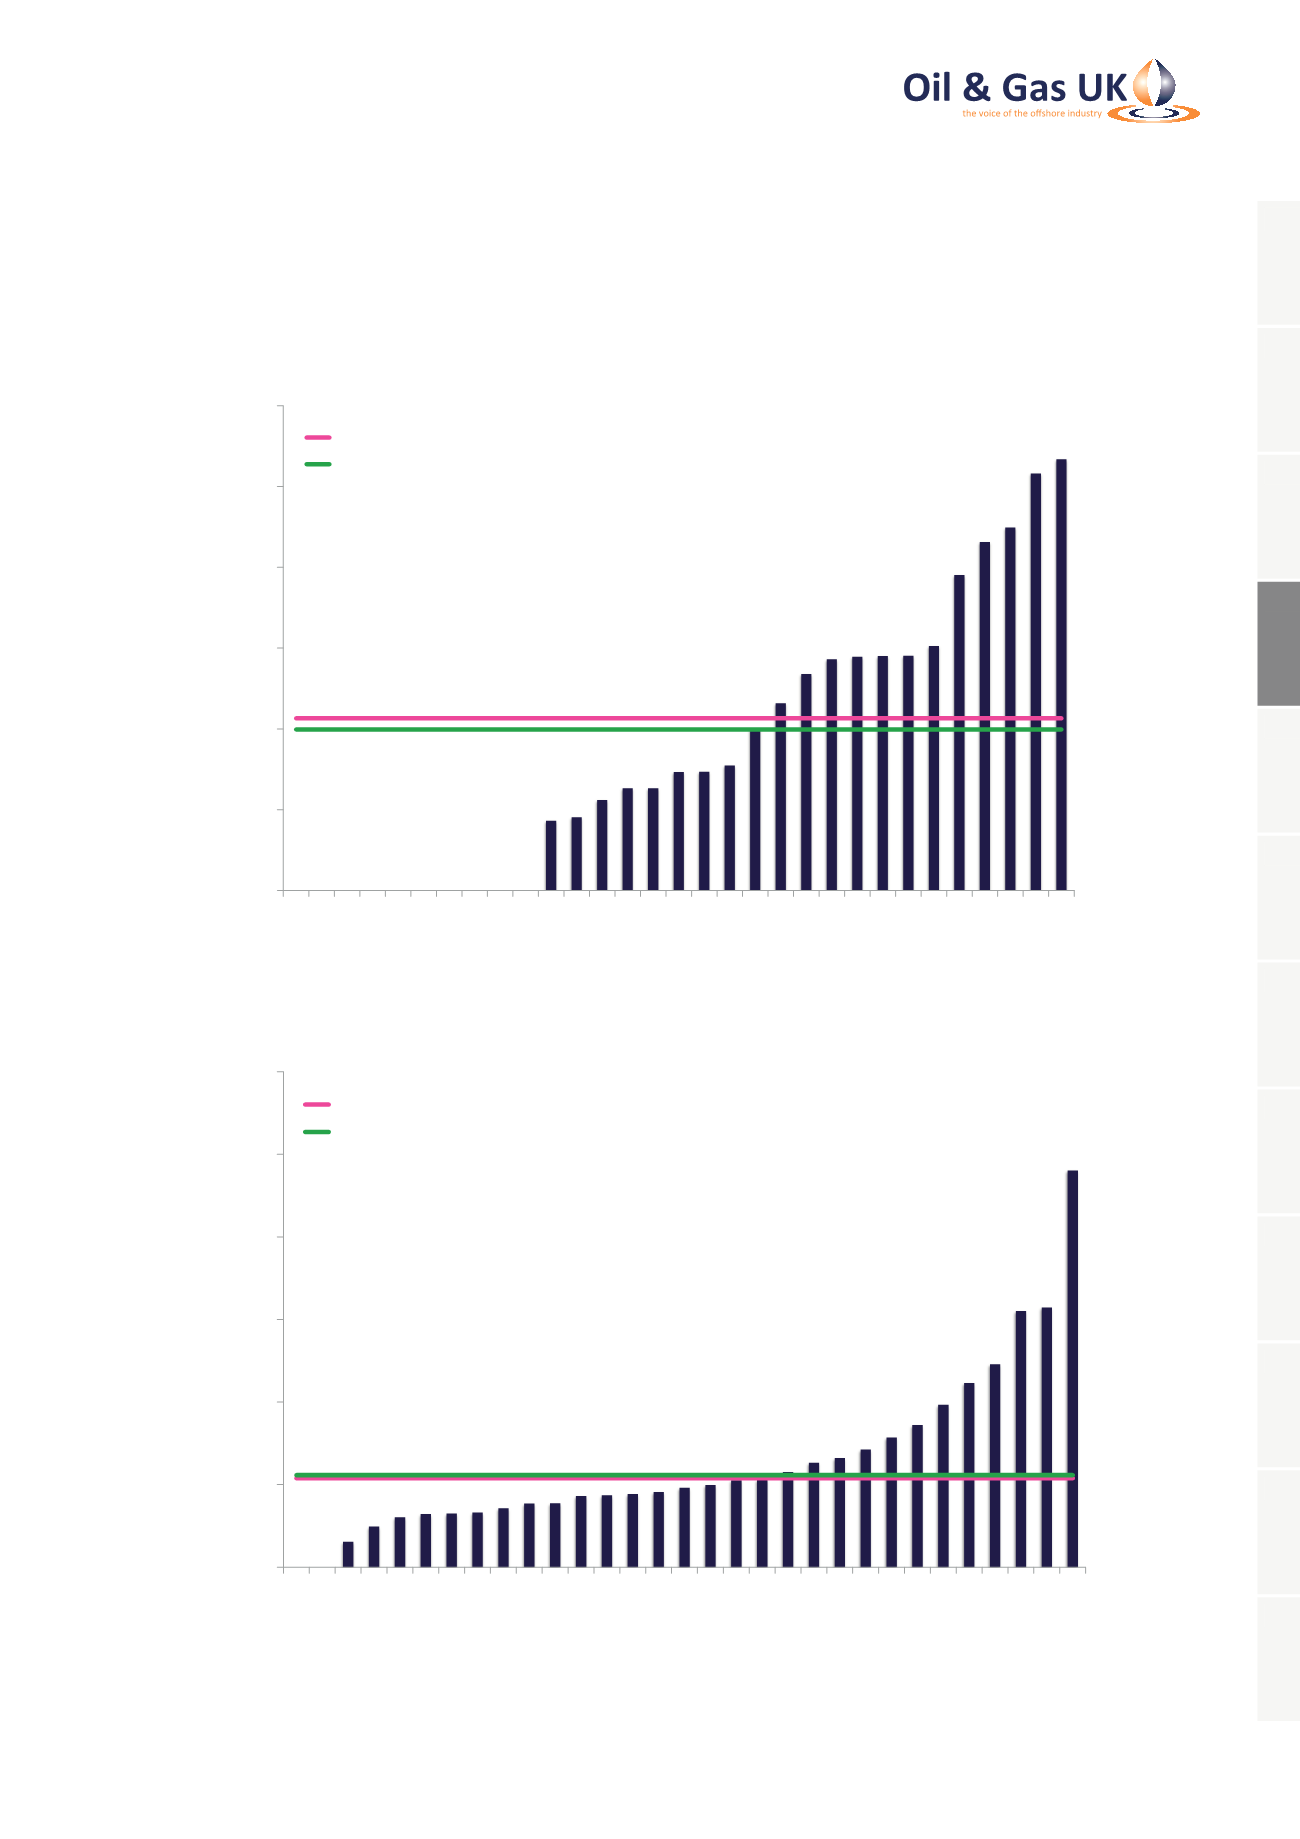
Figure 5: Installation Duty Holders’ Safety Performance Benchmarking Results
0
1
2
3
4
5
6
A B C D E F G H I J K L M N O P Q R S T U V W X Y Z AA AB AC AD AE
Number of Reportable Injuries per Million Man-Hours
Reportable Injuries Frequencies
Industry Average 2014 = 2.13
Industry Average 2013 = 1.99
Source: Health and Safety Executive, Vantage POB and Oil & Gas UK
0
5
10
15
20
25
30
A B C D E F G H I J K L M N O P Q R S T U V W X Y Z AA AB AC AD AE
Dangerous Occurrences per Million Man-Hours
Dangerous Occurrence Frequencies
Industry Average 2014 = 5.39
Industry Average 2013 = 5.57
Source: Health and Safety Executive, Vantage POB and Oil & Gas UK
1
2
3
4
5
6
7
8
9
10
11
12