
10
Dairy
products
Roots
and tubers
Fruits and
vegetables
Total production
Production
Loss and waste
Oil crops
and pulses
Cereals
Fish
Meat
2 404
798
551
1 644
264
49
146
46
767
116
707
346
97
664
6 574
North America
and Oceania
Europe
South and
Southern
Asia
Latin
America
Industrialized
Asia
Sub-Saharan
Africa
North Africa,
West and
Central Asia
Per capita food
loss and waste
Kilogrammes per year
Total food production volume
and food loss and waste
Million tonnes
0
50
100
150
200
250
300
350
Production to retail
Consumption
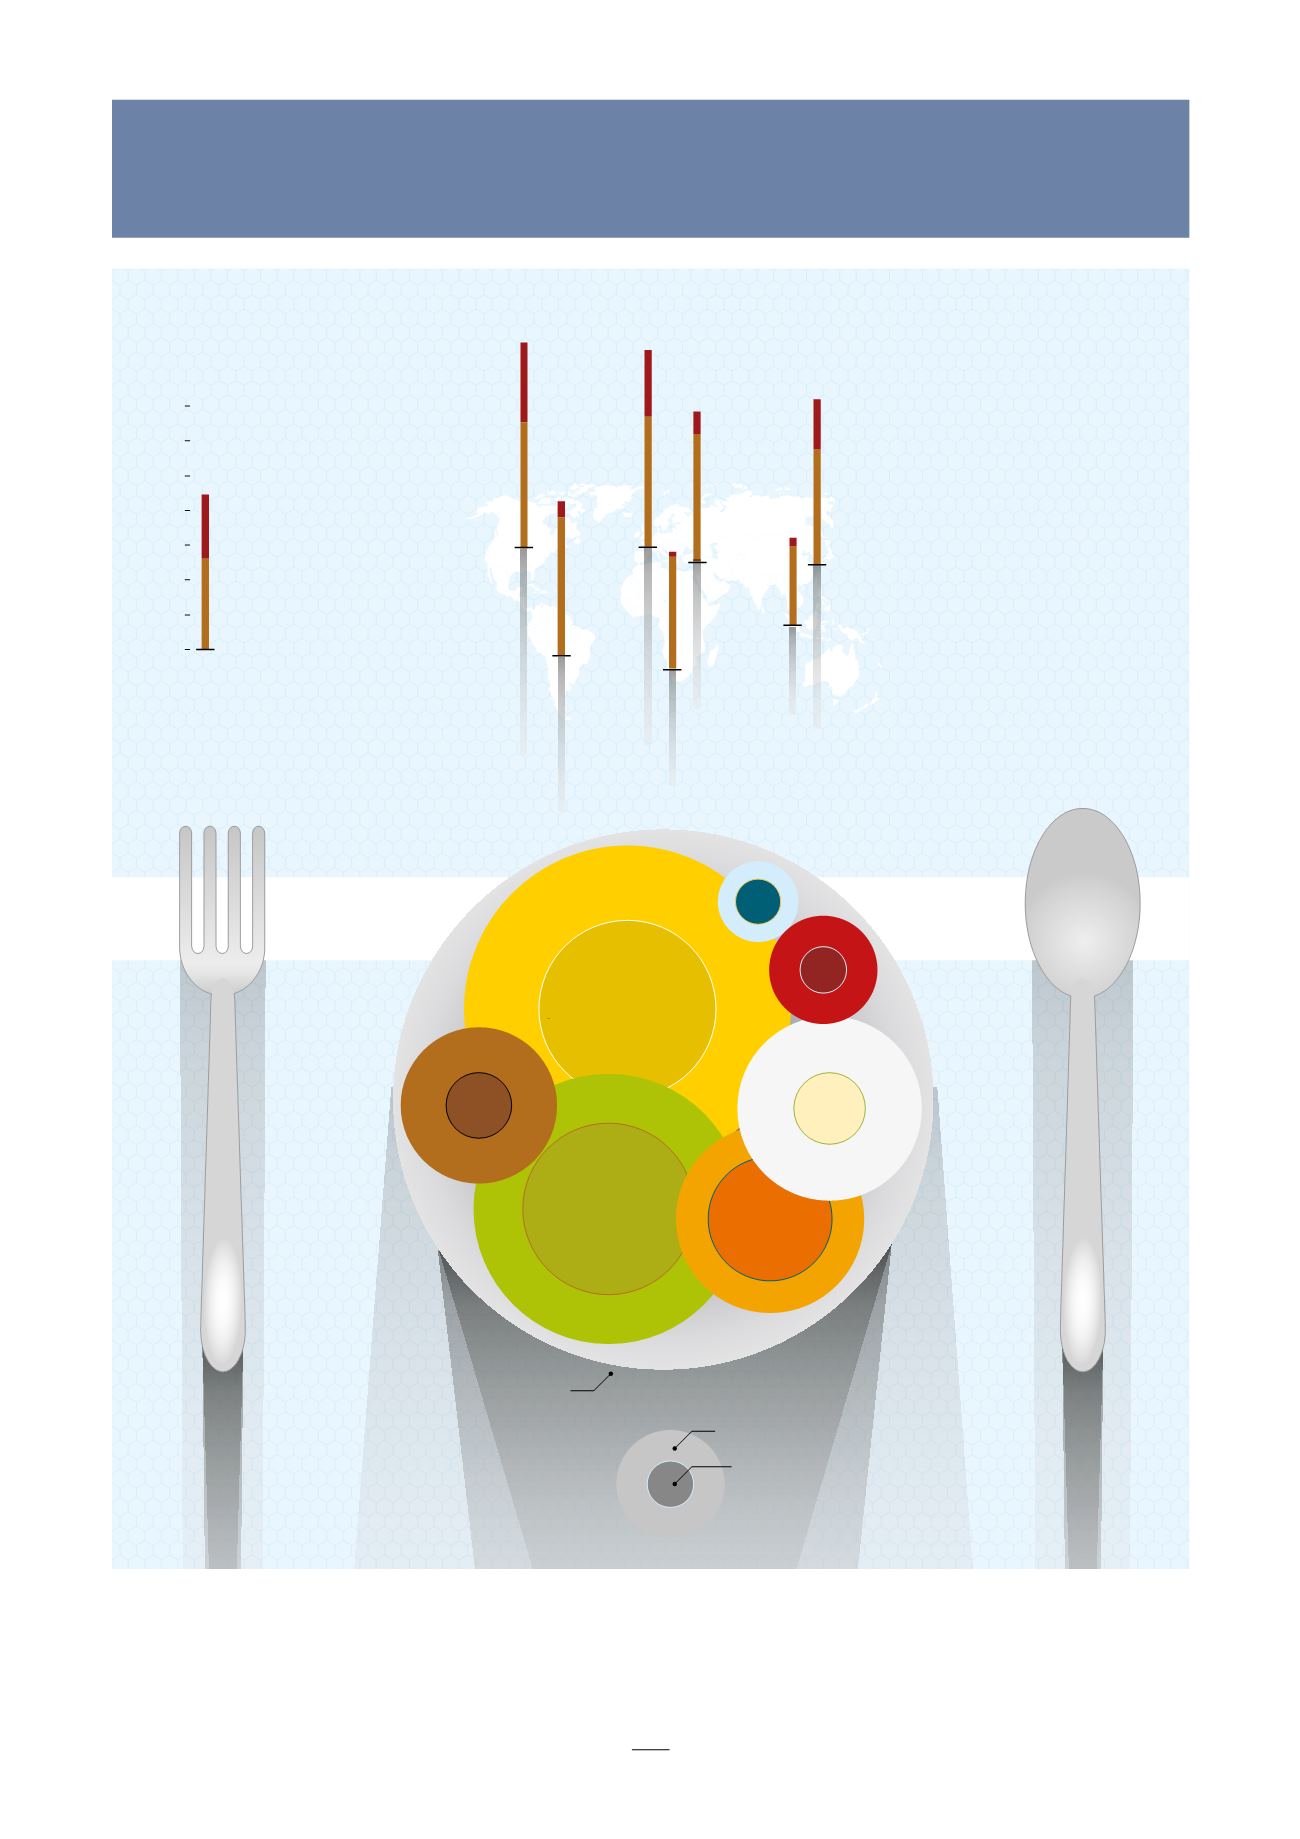
This graphic shows how much food is lost and wasted in the world every year. It breaks down the data by region and shows that losses
on the way to market (production to retail) are higher in the developing world. However, in wealthier countries more food is wasted
after it is purchased (consumption). A joint study with UNEP, Food Wasted, Food Lost, argued that ecosystem degradation is a major
cause of loss in potential food production, while human practices and preferences are blamed not only for food loss but also food waste.
The report called for better management and restoration of food producing ecosystems.


