


 16 / 35


734
L
acorn
et al
.:
J
ournal of
AOAC I
nternational
V
ol
.
99, N
o
.
3, 2016
No quality guarantee is accepted after expiry of the kit (
see
expiry label). Do not interchange individual reagents between
kits of different lot numbers.
(b)
Special attention should be directed to the interpretation
of positive and negative outcomes (use of evaluation card and
control samples).
(c)
Bring the dipsticks to room temperature (20–25°C)
before first use (after first use, store at room temperature).
The dipsticks are very sensitive to humidity, which could turn
the test useless. For this reason, keep the strips away from
humidity.
(d)
Use also gluten-free and gluten-containing samples
as test controls (e.g., R7010 for ethanol extraction and
R7012 for Cocktail extraction; both products are distributed
by R-Biopharm AG, Germany). If the negative assay control
sample is evaluated as positive, then a contamination of the
laboratory or laboratory equipment is likely.
(e)
It is recommended to compare the extraction efficiency
of ethanol with the Cocktail (patented; R7006) in the case of
unknown samples.
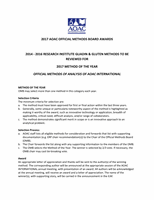
I. Dipstick Testing
(a)
Place the dipstick vertically into the test tube filled with
the diluted sample extract. The arrow on the dipstick should
point down (
see
also Figure
2015.16
). Do not immerse the
dipstick beyond the maximum line.
(b)
Take out the stick after exactly 5 min (±10 s) and evaluate
the result using the evaluation card (C).
(c)
For documentation and prolonged storage, the upper part
of the dipstick marked with “Gluten,” together with the test
bands, should be cut off.
J. Dipstick Evaluation
(a)
Positive result
.—If two colored bands (test band in
red and control band in blue) are visible in the result window
(
see
Figure
2015.16
) after 5 min, the sample is positive for
gluten.
(b)
Negative result
.—If only the blue control band is visible
in the result window (
see
Figure
2015.16
) after 5 min, the
sample is negative for gluten.
(c)
Invalid result
.—If no bands occur after 5 min, the test is
invalid and should be repeated using a new dipstick.
K. Result Reporting
(a)
Positive result
.—A nonprocessed sample contains more
than 5.0 mg/kg gluten. A processed sample contains more than
8.0 mg/kg gluten.
(b)
Negative result
.—A nonprocessed sample contains less
than 5.0 mg/kg gluten. A processed sample contains less than
8.0 mg/kg gluten.
L. Result Interpretation
(a)
The test strip has been developed for the detection of
traces of gluten.
(b)
Anegative result does not necessarily indicate the absence
of gluten as the gluten may not be homogenously distributed or
the level of gluten in the product is below the LOD.
(c)
The LOD is dependent on sample type and extraction
efficiency.
(d)
In case of a positive result, the RIDASCREEN Gliadin
(Art. No. R7001) should be used for quantification. This test
kit is also AOAC Research Institute and AOAC First Action
Official Method of Analysis
status validated.
M. Criteria for Acceptance of a Result
(a)
Accept results if quality control samples (R7012, R7013,
or spiked samples) are evaluated correctly.
(b)
Appearance of test line and control line should be
according to the evaluation card.
Results and Discussion
Collaborative Study Results
All participants reported to the study director that no
contamination occurred in their laboratories and that all control
samples were evaluated in the expected way.
The results for each sample and each laboratory are shown in
Table 1 (ethanol extraction) and Table 2 (Cocktail extraction).
Every laboratory analyzed 10 replicates for each concentration.
Especially for the ethanol extraction, the results were uniform
and 14 of 18 laboratories showed no false positives or false
negatives. From the remaining four laboratories, only one
laboratory assigned 2 of 10 blank samples as false positives.
The other three laboratories found one false negative for the low
concentration and only one laboratory found two false negatives
Table 1. Numbers of positive samples detected using the
R5 dipstick after ethanol extraction
a
Sample 1
(negative)
Sample 2
(low)
Sample 3
(medium)
Sample 4
(high)
Gluten,
mg/kg
1.76
4.84
11.0
18.8
Laboratory
code
Total
Positive Positive Positive Positive
A
10
0
10
10
10
B
10
0
10
10
10
D
10
0
10
10
10
E
10
0
10
10
10
F
10
0
10
10
10
G
10
0
10
10
10
H
10
0
10
10
10
I
10
0
9
10
10
L
10
0
10
10
10
M
10
0
9
8
10
N
10
0
10
10
10
O
10
0
10
10
10
P
10
0
10
10
10
R
10
0
10
10
10
S
10
0
9
10
10
T
10
0
10
10
10
U
10
0
10
10
10
W
10
2
10
10
10
a
Data by each of the 18 participating laboratories; each laboratory
obtained 10 blinded replicates for each concentration level.