


 17 / 35


L
acorn
et al
.:
J
ournal of
AOAC I
nternational
V
ol
.
99, N
o
.
3, 2016
735
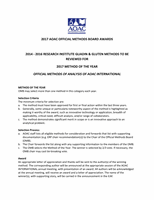
Figure 2. POD observed by each of 18 participating laboratories for
samples extracted with Cocktail solution (part B) between 0.38 and
47.1 mg/kg gluten. Number stated at each circle means number of
laboratories with the same POD. Areas of circles are proportional to
number of laboratories.
for the medium concentrated sample. It should be kept in mind
that the concentration of the blank sample was clearly below the
LOQ of the quantitative ELISA method, but still detectable. At
these low concentrations, an inhomogeneity is not impossible
and, therefore, a few false positives (2 of 180 samples) could be
expected from this viewpoint.
The Cocktail extraction procedure ends upwith a 4-fold higher
dilution compared to the ethanol extraction. Therefore it was
not surprising that the low concentrated sample showed a higher
variation compared to the ethanol extraction. Laboratory B had
to be excluded because it was obvious from the raw data (Excel
sheet sent to the study coordinator) that a blank sample had
been mixed up with a sample containing the high concentration.
Nevertheless, 9 of 17 laboratories reported no false-negative or
false-positive results. Only one laboratory found false-positive
results. In total, 2 of 170 samples were detected as false positive.
This rate is the same as for the ethanol extraction method. It
is interesting to see that for the low-concentrated sample
(6.4 mg/kg), laboratories could be separated into two groups
reporting either 70 up to 100% correct detection or 0 to 10%
correct results. It seems that the visual inspection results in a
clear individual cut-off “color” for a positive sample and not—
as speculated from a hypothetical point of view—a variation
within the fractional range. In conclusion, it will be difficult to
find or prepare a sample within the fractional range as requested
by AOAC Appendix N.
A graphical way to show the results for both collaborative
tests appears in Figure 1 (ethanol extraction) and Figure 2
(Cocktail extraction). In these figures, the probability of
detection (POD) is plotted against the concentration. Note that
only 10% increments are possible for the POD in this figure.
The bigger the area of the circle, the more laboratories reported
this POD, as indicated by the number next to the circles.
Statistical Analysis and Discussion
Following the AOAC Appendix N for the validation of
qualitative methods, some method performance characteristics
were calculated and are shown in Tables 3 and 4 for both
collaborative tests. Reproducibility SDwas in the range between
0.00 and 0.18 after ethanol extraction and between 0.00 and
0.36 after Cocktail extraction. Repeatability SD was between
0.00 and 0.13 (ethanol extraction) and 0.00 and 0.21 (Cocktail
extraction). A nonprocessed sample containing 4.8 mg/kg
Table 2. Numbers of positive samples detected using the
R5 dipstick after Cocktail extraction
a
Sample 5
(negative)
Sample 6
(low)
Sample 7
(medium)
Sample 8
(high)
Gluten,
mg/kg
0.38
6.4
13.3
47.1
Laboratory
code
Total
Positive Positive Positive Positive
A
10
2
7
10
10
B
b
10
1
10
10
9
D
10
0
9
10
10
E
10
0
1
10
10
F
10
0
10
10
10
G
10
0
10
10
10
H
10
0
10
10
10
I
10
0
9
10
10
L
10
0
8
10
10
M
10
0
10
10
10
N
10
0
10
10
10
O
10
0
10
10
10
P
10
0
10
10
10
R
10
0
10
10
10
S
10
0
0
10
10
T
10
0
9
10
10
U
10
0
1
10
10
W
10
0
10
10
10
a
Data by each of the 18 participating laboratories; each laboratory
obtained 10 blinded replicates for each concentration level.
b
Data set of Laboratory B was not included in the statistical calculation
because two samples were apparently exchanged.
Figure 1. POD observed by each of 18 participating laboratories
for samples extracted with ethanol (part A) between 1.76 and
18.8 mg/kg gluten. Number stated at each circle means number of
laboratories with the same POD. Areas of circles are proportional to
number of laboratories.