


 21 / 35


104
H
albmayr
-J
ech
et al
.
:
J
ournal of
AOAC I
nternational
V
ol
. 98, N
o
. 1, 2015
laboratories, and kit suppliers fromEurope, United States, Canada,
Australia, and New Zealand participated in the collaborative
study.All collaborators are listed in the
Acknowledgments
section.
Description and Preparation of Samples
The following 12 samples were prepared for the collaborative
study: gluten-free rice flour, rice flour containing 10 mg
gluten/kg, rice flour containing 20 mg gluten/kg, rice flour
containing 100 mg gluten/kg, gluten-free chocolate cake,
chocolate cake containing 10 mg gluten/kg, chocolate cake
containing 20 mg gluten/kg, chocolate cake containing 100 mg
gluten/kg, crisp bread containing 4.5 mg gluten/kg, crisp bread
containing 15 mg gluten/kg, crisp bread containing 24 mg
gluten/kg, and crisp bread containing 102 mg gluten/kg. Initial
target concentrations of the crisp bread samples had been 0,
10, 20, and 100 mg/kg, but a gluten contamination occurred
during the preparation of these samples. The contamination was
independently confirmed with another antibody-based ELISA,
giving further reason to allow a re-estimation of gluten content
of respective samples.
All ingredients except wheat flour were confirmed to be free of
gluten contamination before use by means of the G12 Sandwich
ELISA, which was also used in this collaborative study.
The gliadin content of wheat flour of the German cultivar
‘Genius’ was determined by an extraction/RP-HPLC method as
described byWieser et al. (5). HPLC absorbance values measured
at 210 nm were converted to protein concentration using a
standard solution of reference gliadin from the ProlaminWorking
Group (6). The gliadin content of the wheat flour sample was
67.8±0.16 g/kg (
n
= 3) on an “as is” basis. The gluten content of
the wheat flour was calculated according to Codex (gluten = 2 ×
prolamin) and was 135.6 g/kg.
Samples were heat-treated to a different extent during
processing as found in consumer products. Rice flour was used
“as is” (not heat-treated) and represented a base material for
the production of gluten-free rice based products. Gluten-free
rice flour was provided by General Mills (Minneapolis, MN).
Gluten-containing stock rice flour with a gluten concentration
of 200 mg/kg was prepared by mixing wheat flour into rice
flour and subsequently diluting the mixture with rice flour.
Gluten-containing rice flour samples were prepared as follows:
10 mg/kg, 17.5 g stock rice flour was mixed with 332.5 g
gluten-free rice flour; 20 mg/kg, 35 g stock rice flour was mixed
with 315 g gluten-free rice flour; and 100 mg/kg, 175 g stock rice
flour was mixed with 175 g gluten-free rice flour. Mixtures were
shaken in an overhead shaker for at least 1 h.
Chocolate cake represented a product that had been moderately
heat-treated, but with typical chocolate components that are
known to be challenging for ELISA tests. Gluten-free chocolate
Table 2. Spike recovery data from single-laboratory
validation data: samples were tested both in their original
state and spiked with 10 mg/kg of Vital wheat gluten
extract. Percentage recovery was calculated against a
positive control spiked into extraction buffer. Recovery of
10 mg/kg spike was achieved from a range of processed
food samples within an acceptable range (90–145%). The
addition of gelatin to the extraction solution significantly
increased the extraction efficiency from chocolate
Romer extraction solution
Sample
No spike
Spike
(10 ppm gluten)
Spike
CV, % Recovery, %
Crisps
<4
12.6
1.35
134.0
Chocolate
<4
<4
NA
a
NA
Chocolate + gelatin <4
10.3
1.84
109.6
Cheesy corn snack
<4
8.5
5.33
90.4
Paprika
<4
10.8
0.16
114.9
Chicken
<4
9.7
2.44
103.2
Yogurt
<4
9.4
0.88
100.0
Curry sauce
<4
12.4
0.31
131.9
Margarine
<4
13.6
7.00
144.7
Positive control
NA
9.4
1.31
100.0
a
NA = Not applicable.
Table 1. Calculation of LOD from single-laboratory
validation data: 47 replicates of buffer blanks were run
over 10 individual AgraQuant Gluten G12 assays. The LOD
was determined by calculating the mean OD of the 0 mg/kg
standard + 3 SD and then reading this value back off the
standard curve. The lower LOQ was determined by the
lowest standard of concentration.
Standard,
mg/kg
Mean
(OD)
SD
(OD)
CV, %
(OD)
Mean + 3 SD
(OD)
LOD,
mg/kg
0
0.14 0.03
21.15
0.23
2.00
Table 3. Single-laboratory validation data on repeatability
using a single kit: 10 replicates of the standard curve were
run using a single AgraQuant Gluten G12 test kit. Mean
OD values, SD, and CV are shown below. All CV values
for intra-assay analysis were less than 15%, meeting the
manufacturer’s QC criteria
Standard, mg/kg Mean (OD)
SD (OD)
CV, % (OD)
0
0.138
0.018
12.80
4
0.359
0.035
9.88
20
0.698
0.058
8.34
80
1.340
0.073
5.43
200
1.877
0.109
5.82
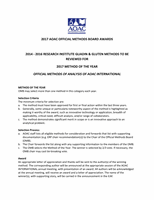
Figure 1. Calibration curve of monoclonal G12 ELISA: Six
replicates each of the Vital wheat gluten and PWG gliadin standards
were run on the AgraQuant Gluten G12 test kit. Error bars indicate
2 × SD of standard.