


 10 / 12

WORKFORCE REPORT
2017
10
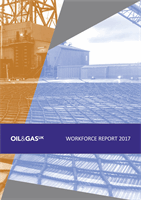
Figure 10: Geographical Distribution of the Offshore Workforce on the UKCS in 2016
Source:VantagePOB
West of Shetlands
Total
% of Total
Workforce
Males
Females
2016
4,304
8%
4,160
144
2014
1,704
3%
1,606
99
Morecambe Bay (incl. East Irish Sea)
Total
% of Total
Workforce
Males
Females
2016
1,100
2%
1,054
46
2014
1,261
2%
1,220
41
Central North Sea
Total
% of Total
Workforce
Males
Females
2016
22,739
43%
21,747
992
2014
31,408
49%
30,076
1,332
Northern North Sea
Total
% of Total
Workforce
Males
Females
2016
5,221
10%
5,060
161
2014
8,482
13%
8,196
286
Southern North Sea
Total
% of Total
Workforce
Males
Females
2016
6,210
12%
6,062
148
2014
6,023
9%
5,863
160
Multiple Sectors
Total
% of Total
Workforce
Males
Females
2016
12,917
25%
12,611
306
2014
15,235
24%
14,850
385
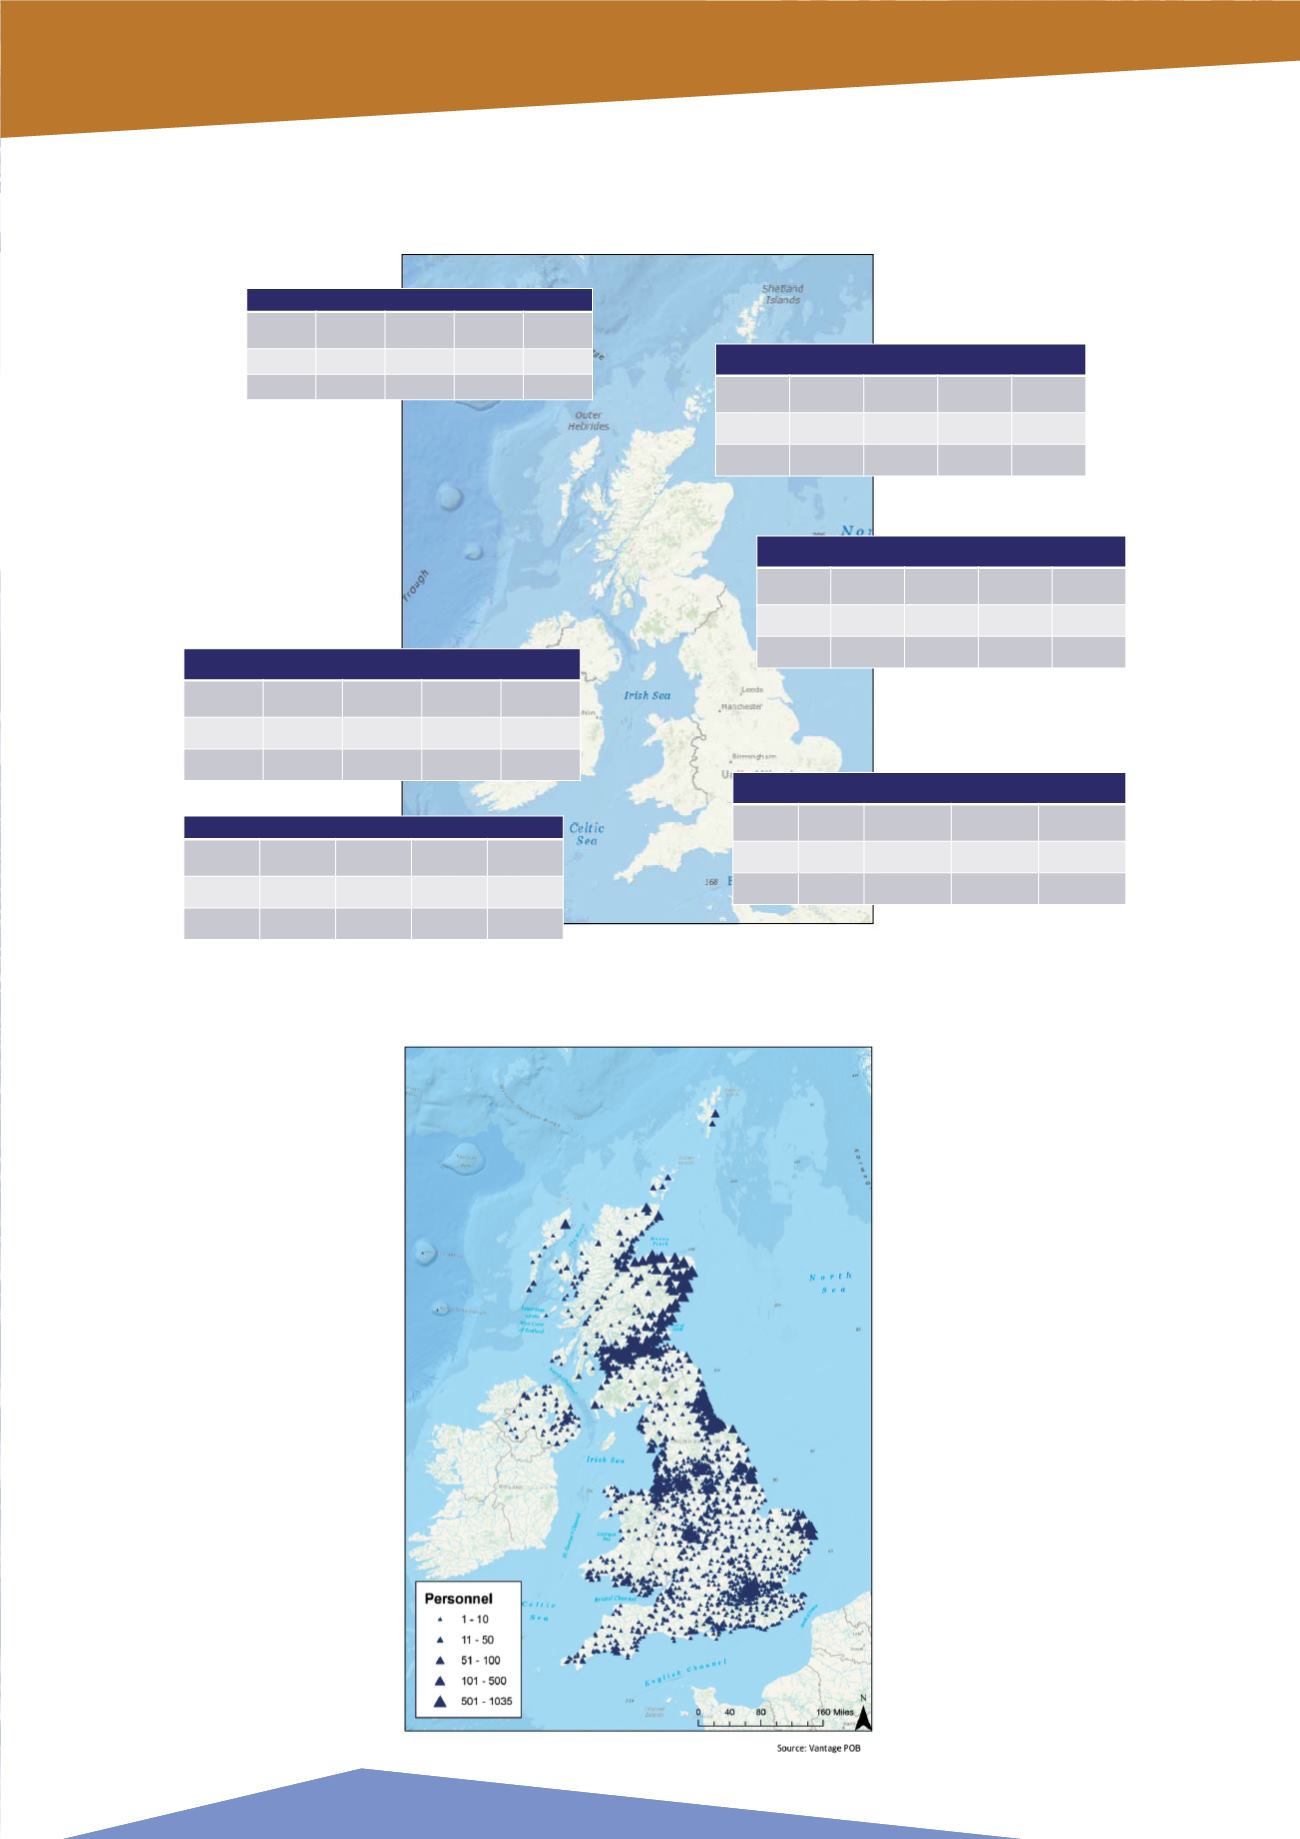
Figure 11: Distribution of the UK Offshore Workforce in 2016 by UK Home Address
Percentages are calculated using the figures for the total offshore workforce in that year