
5
2
3. Graphs
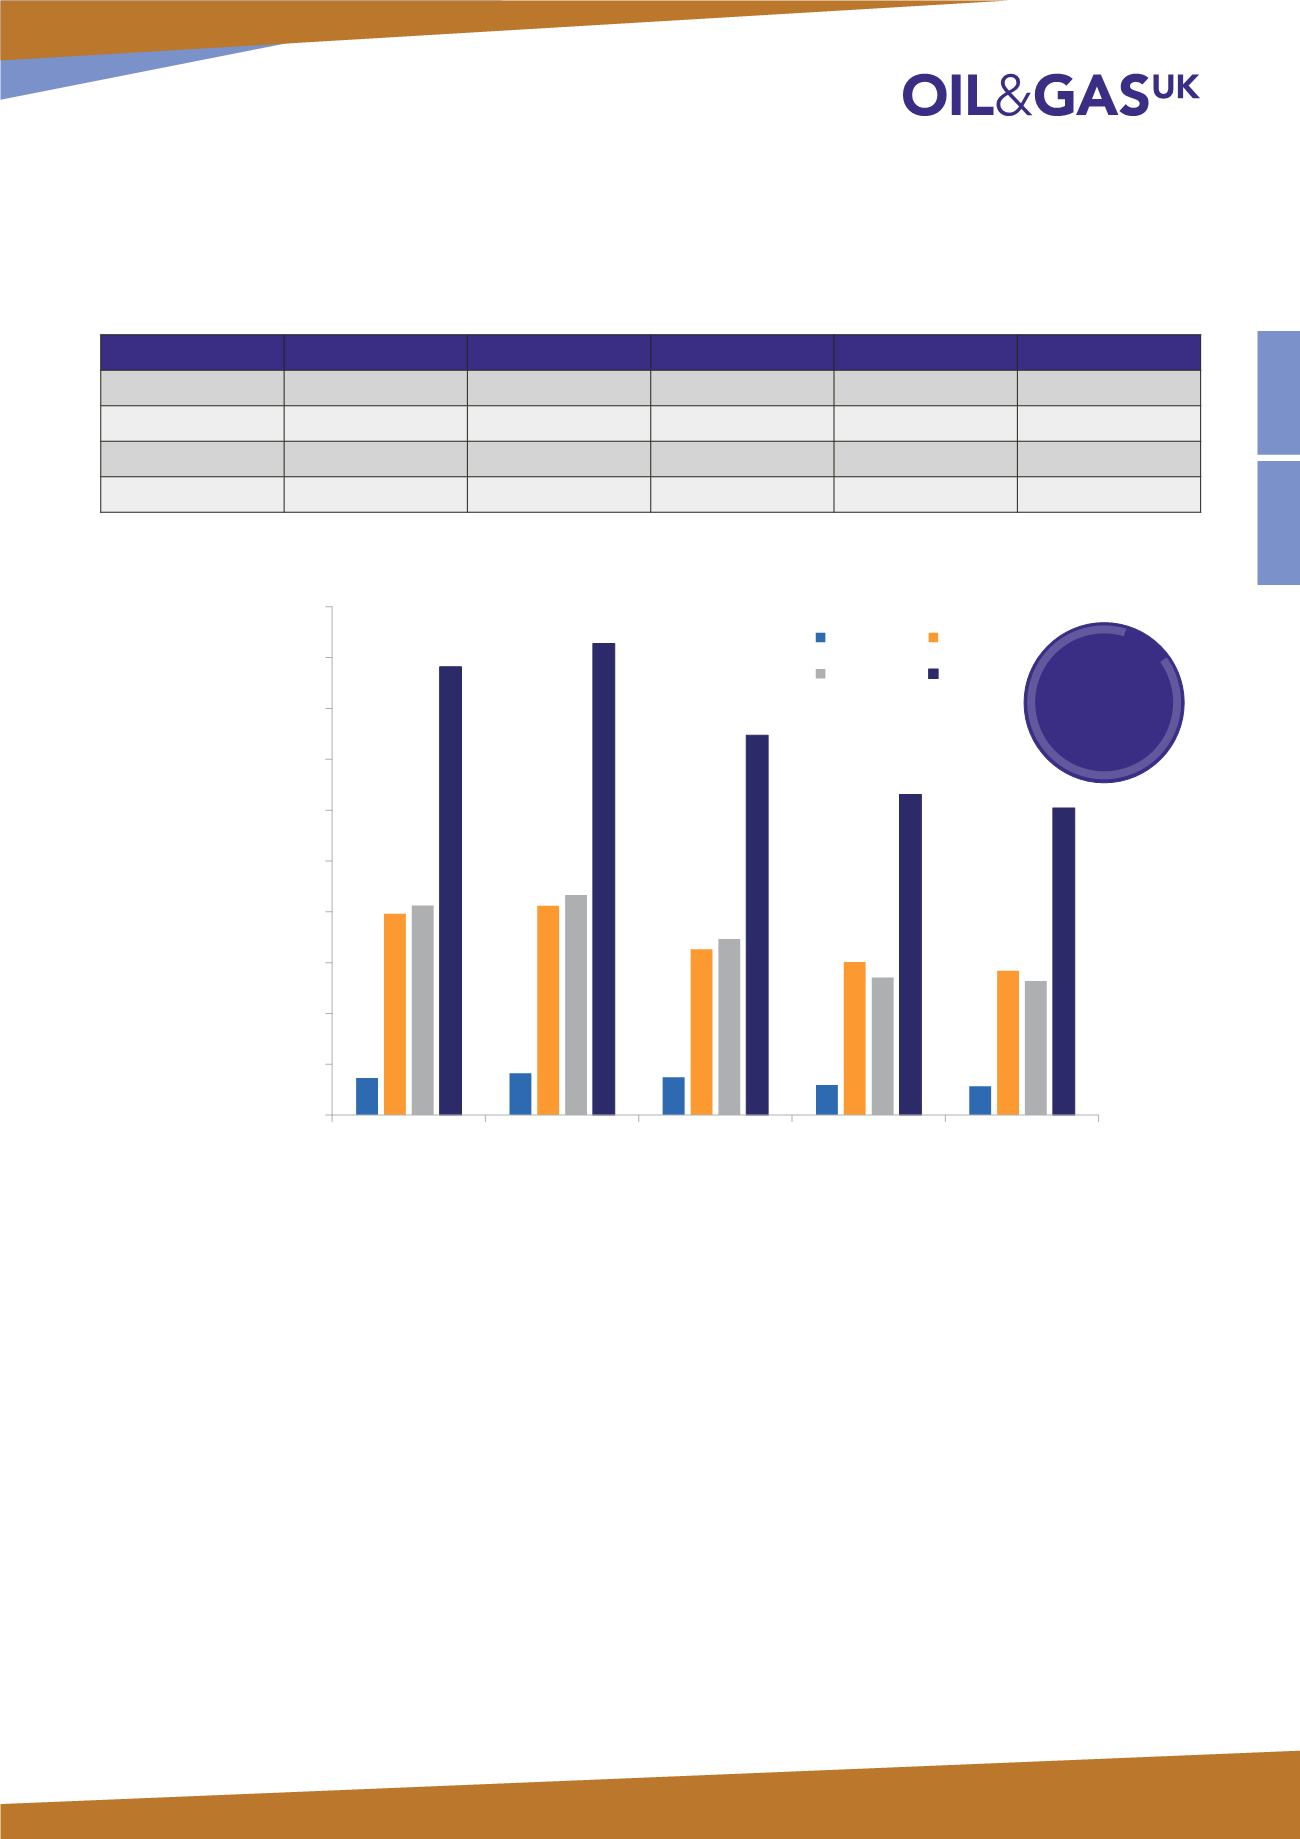
Figure 1: Total Employment Supported by the UK Upstream Oil and Gas Industry
2013
2014
2015
2016
2017
Direct
36,600
41,300
37,300
29,500
28,300
Indirect
198,100
206,100
163,100
150,600
141,900
Induced
206,200
216,500
173,400
135,300
132,000
Total
440,900
463,900
373,800
315,400
302,200
0
50,000
100,000
150,000
200,000
250,000
300,000
350,000
400,000
450,000
500,000
2013
2014
2015
2016
2017
Employment Supported by the Upstream
Oil and Gas Industry
Direct
Indirect
Induced
Total
Source: Experian
3
The latest
employment
estimate is around
160,000 lower than
the peak of more
than 460,000 jobs
in 2014


