


 7 / 12

3
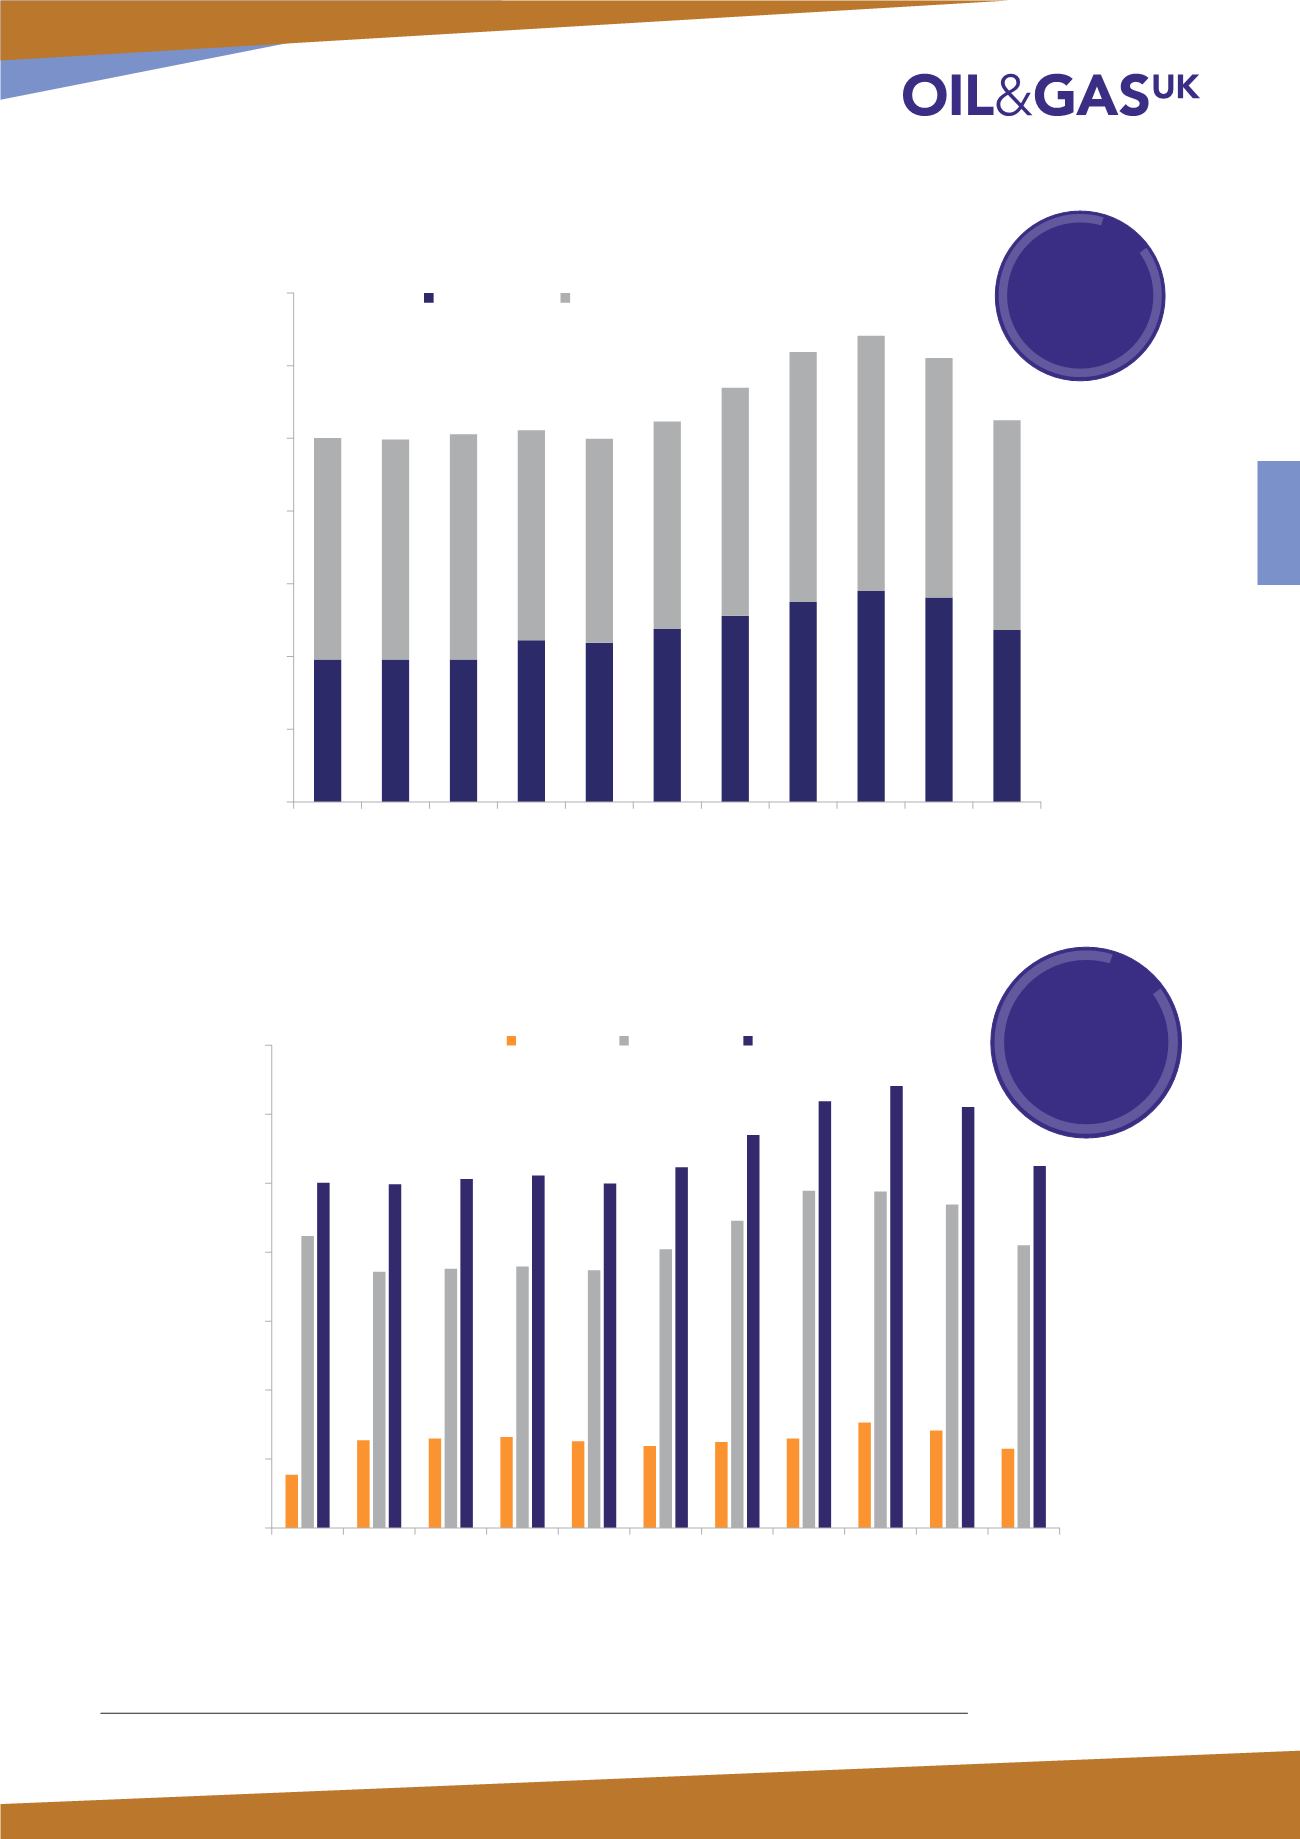
Figure 4: Core
2
and Non-Core Offshore Personnel
0
10,000
20,000
30,000
40,000
50,000
60,000
70,000
2006 2007 2008 2009 2010 2011 2012 2013 2014 2015 2016
Number of Personnel
Core
Non-Core
Source: Vantage POB
Figure 5: Total Personnel Travelling Offshore for Operators and Contractors
0
10,000
20,000
30,000
40,000
50,000
60,000
70,000
2006 2007 2008 2009 2010 2011 2012 2013 2014 2015 2016
Number of Personnel
Operators
Contractors
Total
Source: Vantage POB
2
Core personnel are those who spend more than 100 nights offshore in a year.
7
The total number of
offshore workers fell
to around 52,000 last
year, 45 per cent of
whom spent more than
100 nights offshore
Over three-quarters of
the offshore workforce
are employed within the
contractor community
(non-exploration and
production companies)