


 8 / 12

WORKFORCE REPORT
2017
8
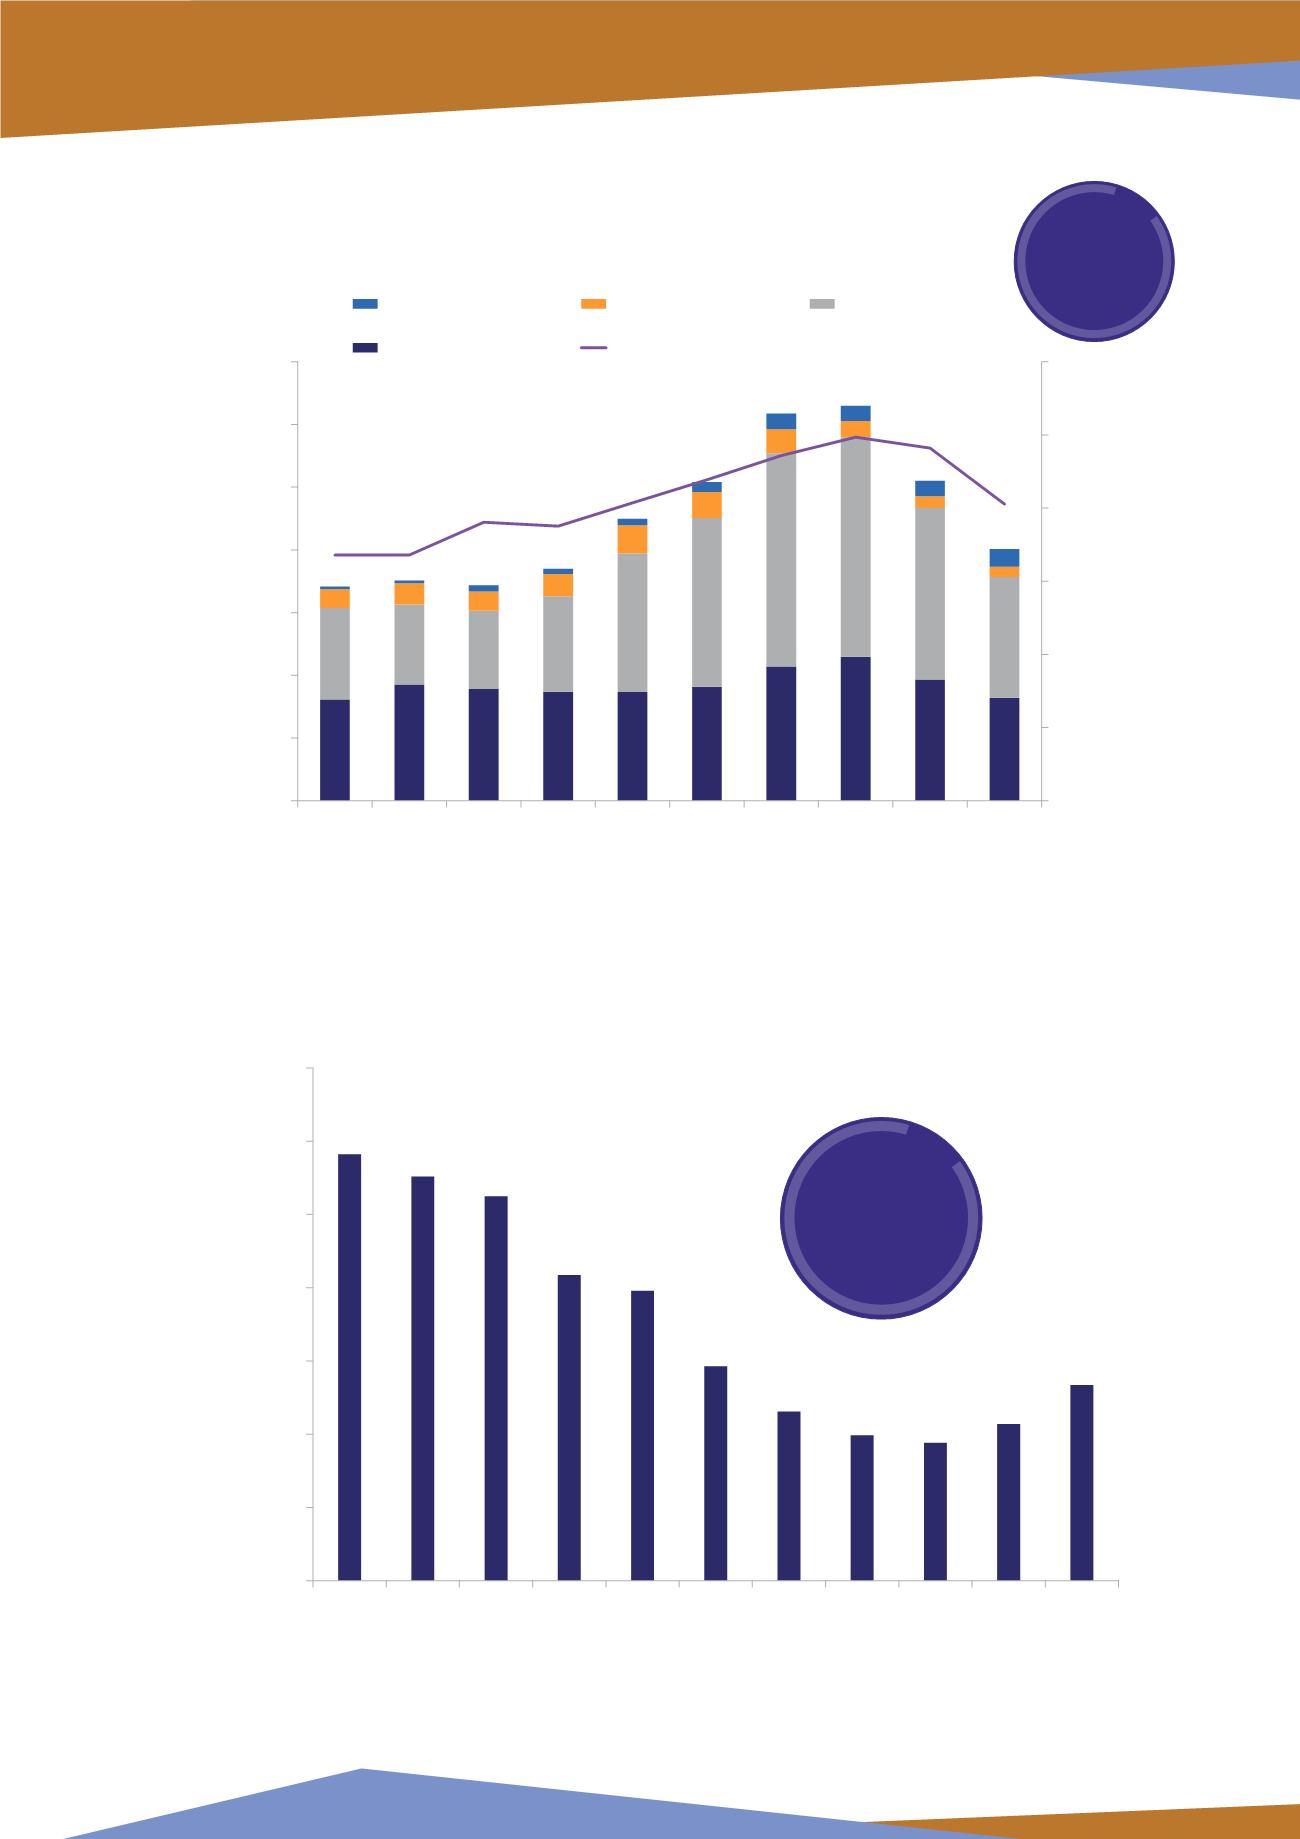
Figure 6: Number of Core Workers versus Total Expenditure
0
5
10
15
20
25
30
0
5,000
10,000
15,000
20,000
25,000
30,000
35,000
2007 2008 2009 2010 2011 2012 2013 2014 2015 2016
£ Billion (2016 Money)
Number of Core Personnel
Decommissioning Costs
Exploration and Appraisal
Development Costs
Operating Costs
Core Workforce
Source: Vantage POB, Oil & Gas UK
Figure 7: Annual Production per Core Worker
0
10,000
20,000
30,000
40,000
50,000
60,000
70,000
2006 2007 2008 2009 2010 2011 2012 2013 2014 2015 2016
Production per Core Worker (barrels of oil equivalent)
Source: Vantage POB, Oil and Gas Authority
The number of
core workers is
strongly correlated
to total industry
expenditure
Production per core
worker has improved by
more than 40 per cent
since 2014. This is due to
the UKCS becoming more
efficient and several
new field start-ups
and restarts