


 11 / 44

BLACK
SEA
ATLANTIC
OCEAN
M
E
D
I
T
E
R
R
A
N
E
A
N
S
E
A
Norway
Croatia
Germany
Latvia
Romania
Bulgaria
Slovenia
Czech
Republic
Slovak
Republic
Sweden
Spain
Portugal
The
Netherlands
Belgium
Denmark
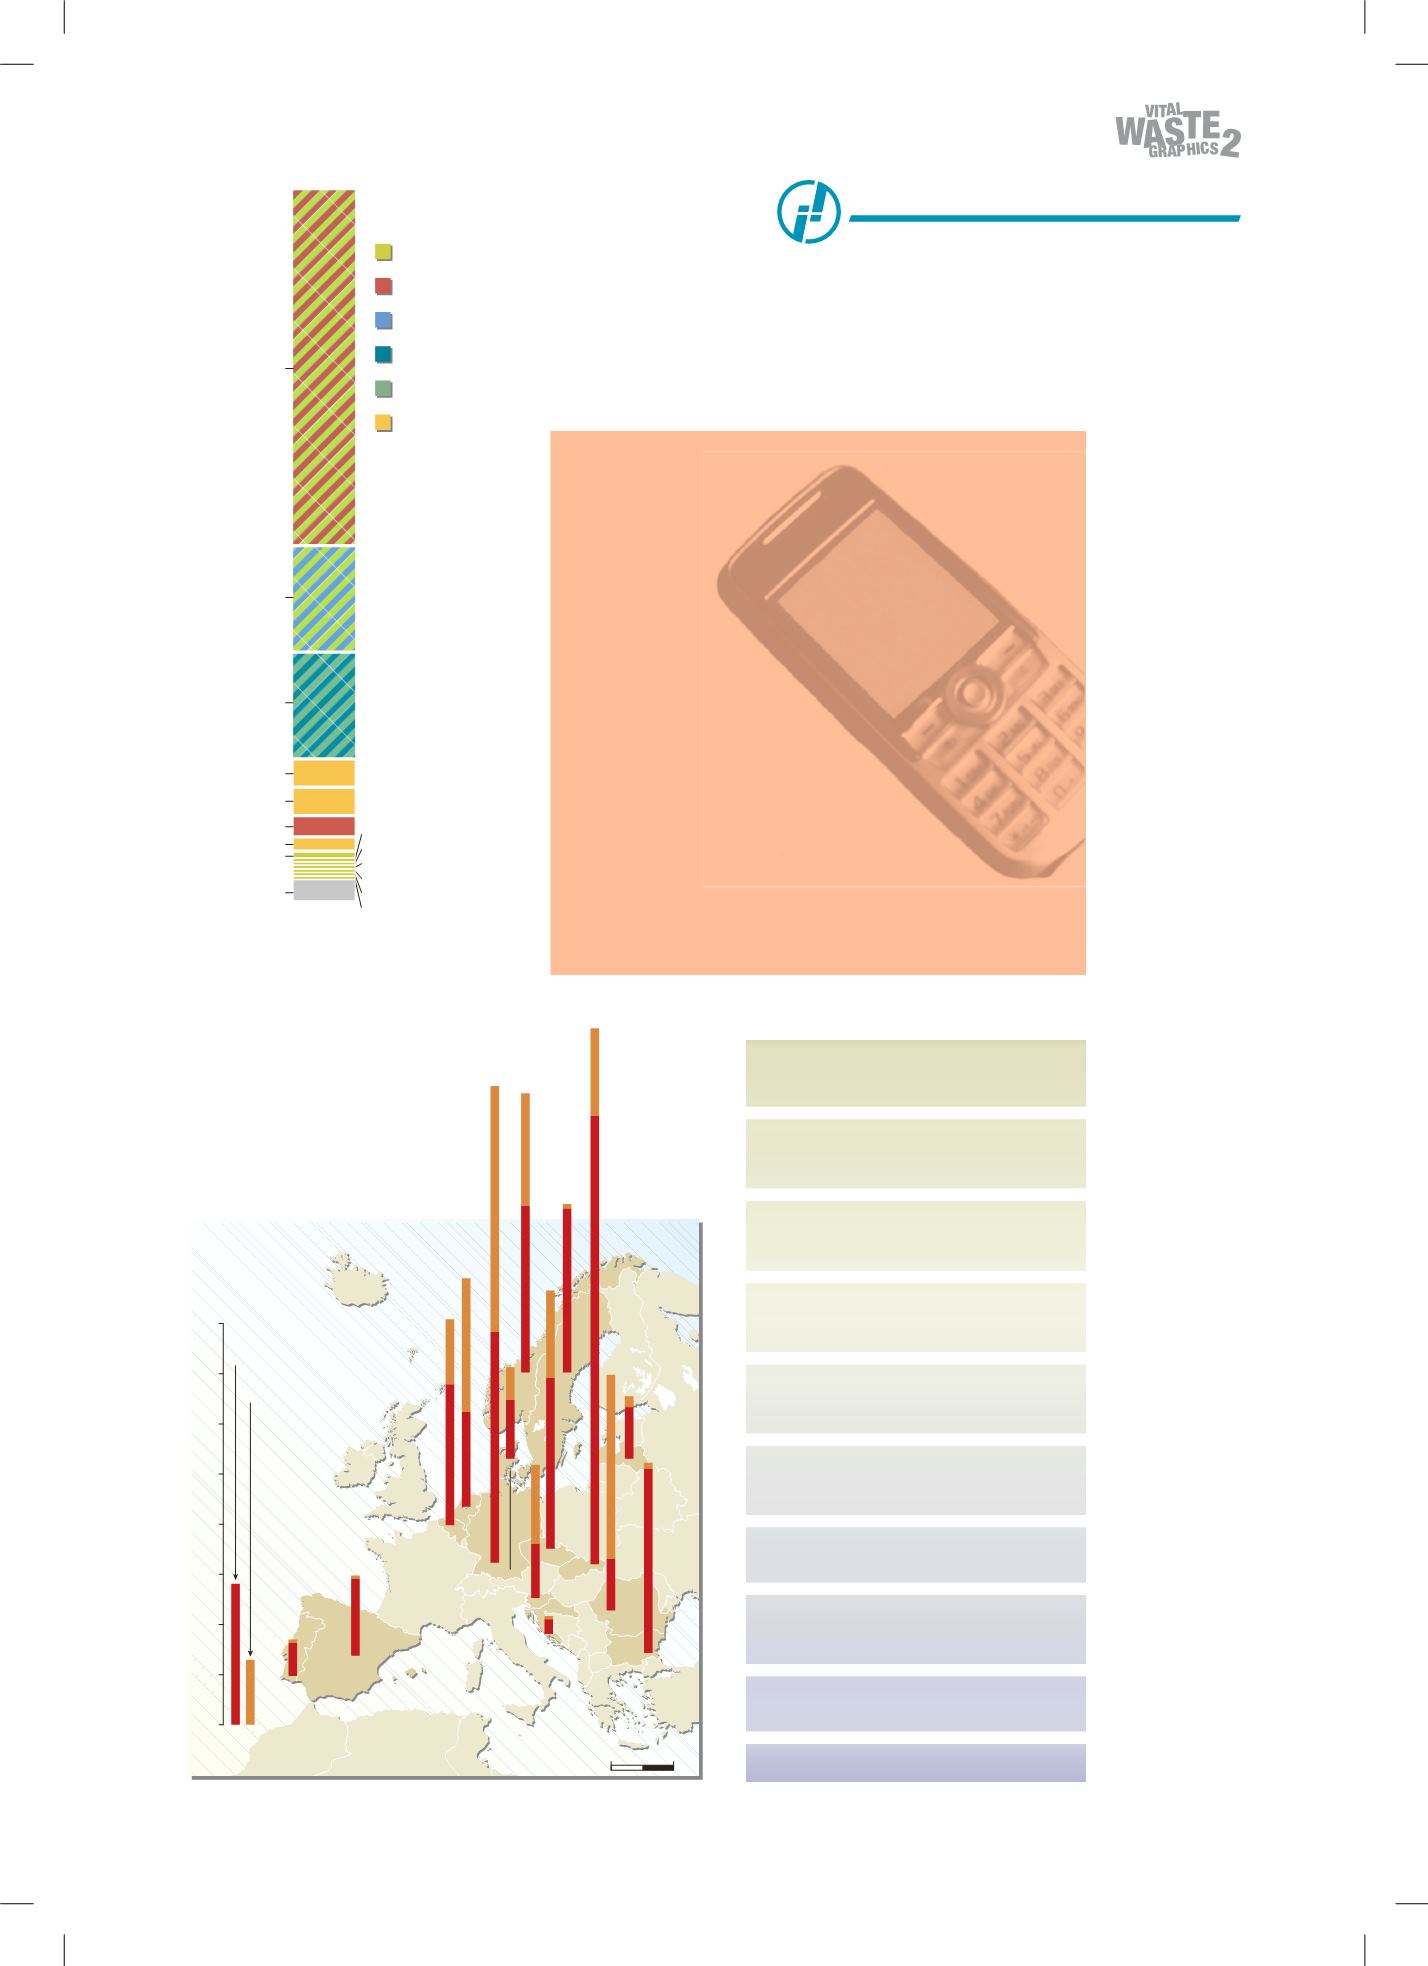
Source: European Commission, Eurostat, Theme Environment and Energy,
Waste generated and treated in Europe. 2005 Edition
(figures for 2002).
0
500 km
Kilograms
per person per year
Manufacturing
industry
Other sectors
Hazardous waste generation
0
25
50
75
100
125
150
175
200
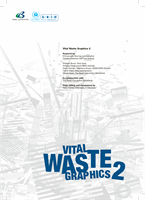
Screen
Batteries
Chips
Case
Circuit
boards
Wires
Plastics 50%
Copper 15%
Glass,
ceramics 15%
Cobalt or
Lithium 4%
Carbon 4%
Ferrous metal 3%
Other* 3%
Nickel 2%
Tin 1%
Cell phone
composition
mostly
contained
in...
0.5%
Zinc
0.5%
Silver
0.5%
Chromium
0.5%
Tantalum
0.5%
Cadmium
0.5%
Lead
*among them, less than 0.1% of antimony, gold and berrylium
Sources: Basel Convention, 2006; Lindholm (Nokia report), 2003.
Ignitable wastes
Spent solvents
Paint wastes
Furniture and wood
Food and
beverages
Animal waste (not always hazardous)
Cleaning wastes
CFCs (refrigerants)
Cleaning
and cosmetic
Heavy metal dusts and sludges
Ignitable wastes
Solvents
Strong acids and bases
Vehicle
maintenance shops
Paint wastes
Ignitable wastes
Spent solvents
Acids and bases
Metal
Paint wastes containing heavy metals
Strong acids and bases
Cyanide wastes
Sludges containing heavy metals
Chemistry
Strong acids and bases
Reactive wastes
Ignitable wastes
Discarded commercial chemical products
Paper
and printing
Ignitable and corrosive wastes
Ink wastes, including solvents and metals
Photography waste with
heavy metals solutions
Leather
and textile
Tanning liquor and effluent
treatment containing chromium
Dyestuffs and pigments
containing dangerous substances
Typical hazardous wastes
generated by selected manufacturing industries
Sources: UACPA, 2002; Commission Decision
2001/118/EC on the European List of Wastes (2001).
ON THE WEB
UNEP’s Division on Technology, Industry and Economics:
www.unep.fr/en/aboutInternational Society for Industrial Ecology:
www.is4ie.orgInvergordon paper mill:
www.forscot.com|
13
12
|
Made in elsewhere
It is impossible to detail all the types of waste directly or
indirectly involved in manufacturing mobile phones. In de-
veloped countries production processes manage to keep
sensitive materials in a closed circuit, without any waste
escaping to the outside world. Production – “Made in Else-
where” – does not usually take place where the phones are
most widespread. It is unlikely such a high degree of effi-
ciency can be achieved in the countries where many mobile-
phone components are assembled, particularly as environ-
mental rules are often difficult to implement there. Assembly
workers can be exposed to a mixture of toxic chemicals,
with waste finding its way into the atmosphere, ground and
water supply, posing a serious risk to their health and that
of the people living in the neighborhood.
Let us take three of the most hazardous metals for both
the environment and human health. Lead is used in monitor
screens, in solder for mounting integrated circuits (chips)
on printed circuit boards (the brains of your phone). Micro-
processors contain mercury. And there is cadmium in the
circuits and battery (mobile phones use 60 per cent of re-
chargeable batteries produced worldwide).