
United
Kingdom
0
10
20
30
40
50
60
70
1998 1999 2000 2001 2002 2003 2004
Recycling rates of different packaging material
in percentage of the specific packaging waste produced
Packaging waste composition in the UK
Sources: UK Department for Environment, Food and Rural Affairs,
e-Digest of
Environmental Statistics
, 2006; Julian Parfitt, WRAP as cited in
Cool Waste Management
,
Greenpeace, 2003.
Paper
Steel
Glass
Aluminium
Plastic
in percentage of total packaging waste
0 10 20 30 40 50 60 70 80 90 100%
Plastic
Plastic
bottles
Plastic
film
among which:
33%
16% 9%
32%
19% 14%
Glass bottles
and jars
Paper and
Cardboard
Metal cans and foil
Mixed beverage containers
See also page 30.
PACKAGING WASTE
The packaging nightmare
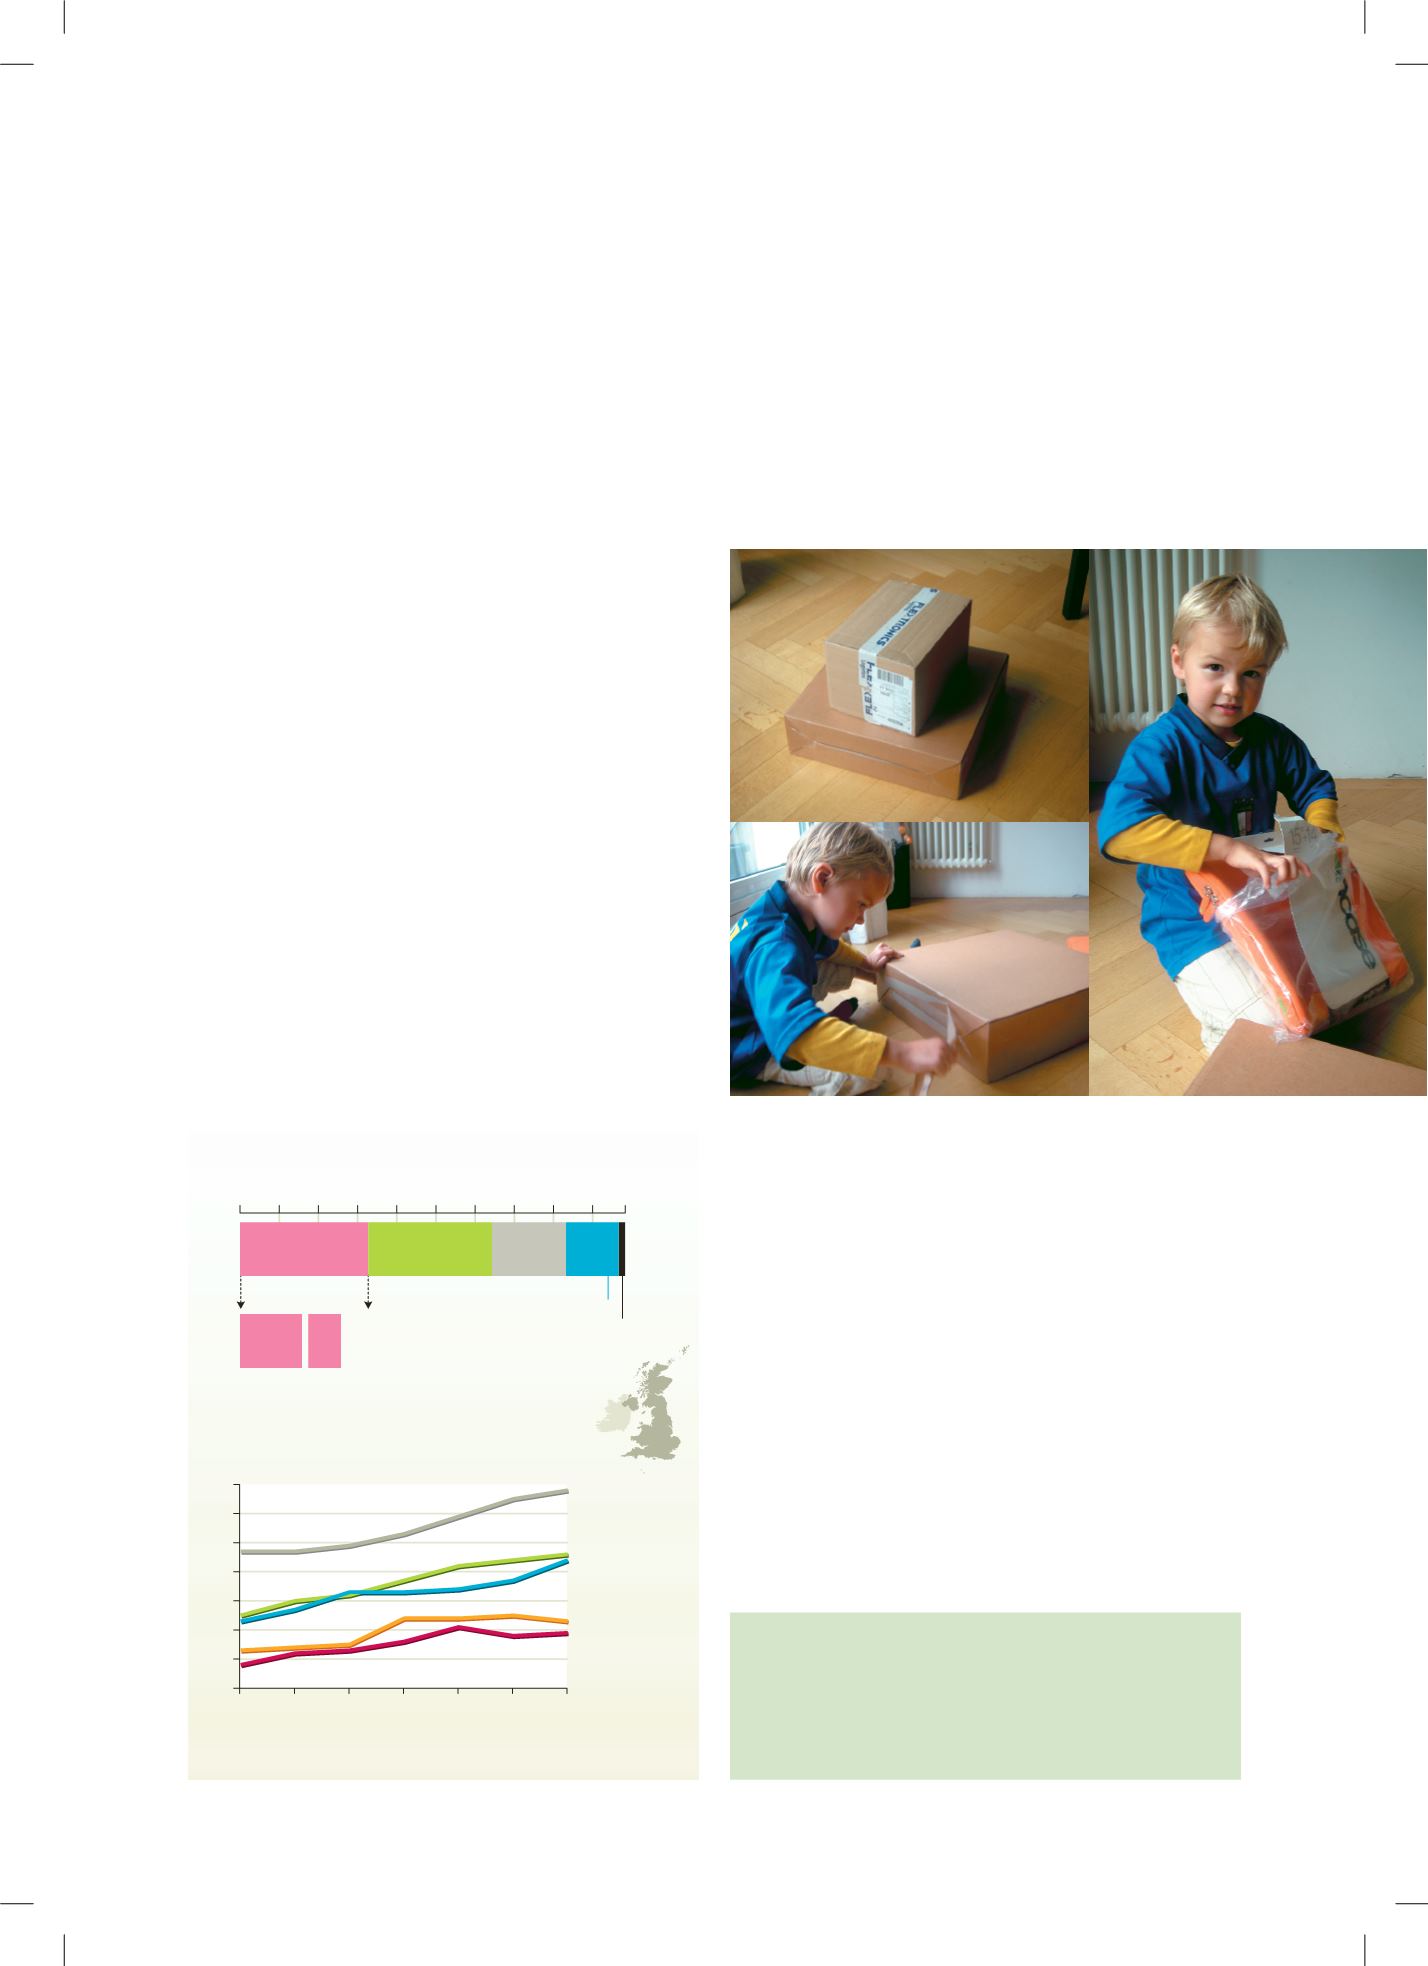
Packaging represents a growing share of the average household’s waste, particularly if you con-
sider not only its weight but also its volume. There are many reasons for this increase: smaller
households, increasing use of convenience food (ready-made meals) at home and on the move,
and higher food hygiene standards. All these factors encourage the use of disposable packaging
and individual portions. But above all packaging is a key component in international trade. Fifty
years ago most of what we consumed was produced nearby. Today even basic goods such as wa-
ter travel halfway round the world to reach us (see following page). Last but not least, packaging is
a major marketing tool, a vector for brand names and consumer values.
The manufacture of packaging itself generates
waste and by definition it has a particularly short
lifespan. It turns into waste as soon as its con-
tents reaches its destination. This is certainly a
blessing for the packaging sector – and the relat-
ed plastics, paper and printing industries – but it
presents a serious challenge for waste manage-
ment (see also pages 24–25 and 26–27).
Plastic packaging
According to Residua, a UK company working on solid
waste issues, about 50 per cent of European goods are
wrapped in plastic (17 per cent by weight). There are many
types of plastic packaging: plastic bottles are often made
of polyethylene terephthalate (PET), yoghurt pots are most-
ly polypropylene (PP), wrapping film, bin liners and flexible
containers are usually low-density polyethylene (LDPE) and
so on. This diversity partly explains why recycling rates for
plastics are low: each type of plastic needs its own recy-
cling process.
Most plastics are derived from oil or gas, the extraction and
processing of which requires large amounts of chemicals and,
of course, generates waste (including hazardous waste).
Facts
One plastic bag
takes 1 second to manufacture, is 20 min-
utes in use, and takes 100-400 years to degrade naturally.
500 thousand million bags
a year distributed worldwide, or
16 000 a second
60 000 tons of plastic
are used in France alone to produce
disposable plastic bags.
Packaging of all kinds
Once a product is manufactured and ready to be sold, it
must be distributed. To protect it from dirt and shocks, to
make it easier to store, but also to make it look appealing,
a whole science has developed to design the most suitable
wrappings. The variety of products demands a huge diver-
sity of packaging and a wide range of materials: cardboard
boxes, glass jars, plastic bags, plastic film, aluminium
wrappers and expanded polystyrene, to name just a few.
Part of it is reused or recycled with varying efficiency de-
pending on the degradability of the components and the ef-
ficiency of the recycling chain (collection and processing).


