
22
JCPSLP
Volume 17, Number 1 2015
Journal of Clinical Practice in Speech-Language Pathology
summary of the descriptive results and Figure 2 displays the
amalgamated results.
Ninety per cent of respondents indicated they felt
they would benefit from participating in professional
development (PD) opportunities regarding CALD in aphasia
rehabilitation/management. Many respondents reported
feeling interested to very interested in participating in PD
participants’ responses also yielded information about other
service delivery concerns such as SLP staffing, interpreter
adequacy, and working with families, information about
these results will be reported elsewhere.
Demographics
All participants we required to have some clinical
experience with aphasia. The average number of years
spent working with PWA was 6.1 (
SD
= 4.6) with a range of
less than 1 to 15 or more years. The majority of
respondents (60.6%) reported providing services in acute
settings and 54.9% in inpatient rehabilitation. Sixty-one per
cent of respondents reported 10% or more of their
caseloads comprised CALD clients.
A large proportion of respondents indicated that they
worked with clients who spoke LOTE, with the 5 most
common languages encountered being Chinese, 67.6%,
Italian, 66.2%, Greek, 46.5%, Vietnamese, 35.2%, and
Arabic, 27.8%. Just over a third of SLPs (37.5%) indicated
they spoke one or more LOTE. The most common LOTE
known by respondents was Italian. There were a number
of languages spoken by their clients for which no SLP
reported proficiency. Of the respondents who reported
speaking LOTEs, only 26% (n = 7) indicated they were able
to provide aphasia assessment and intervention in these
languages.
Knowledge, skills and education
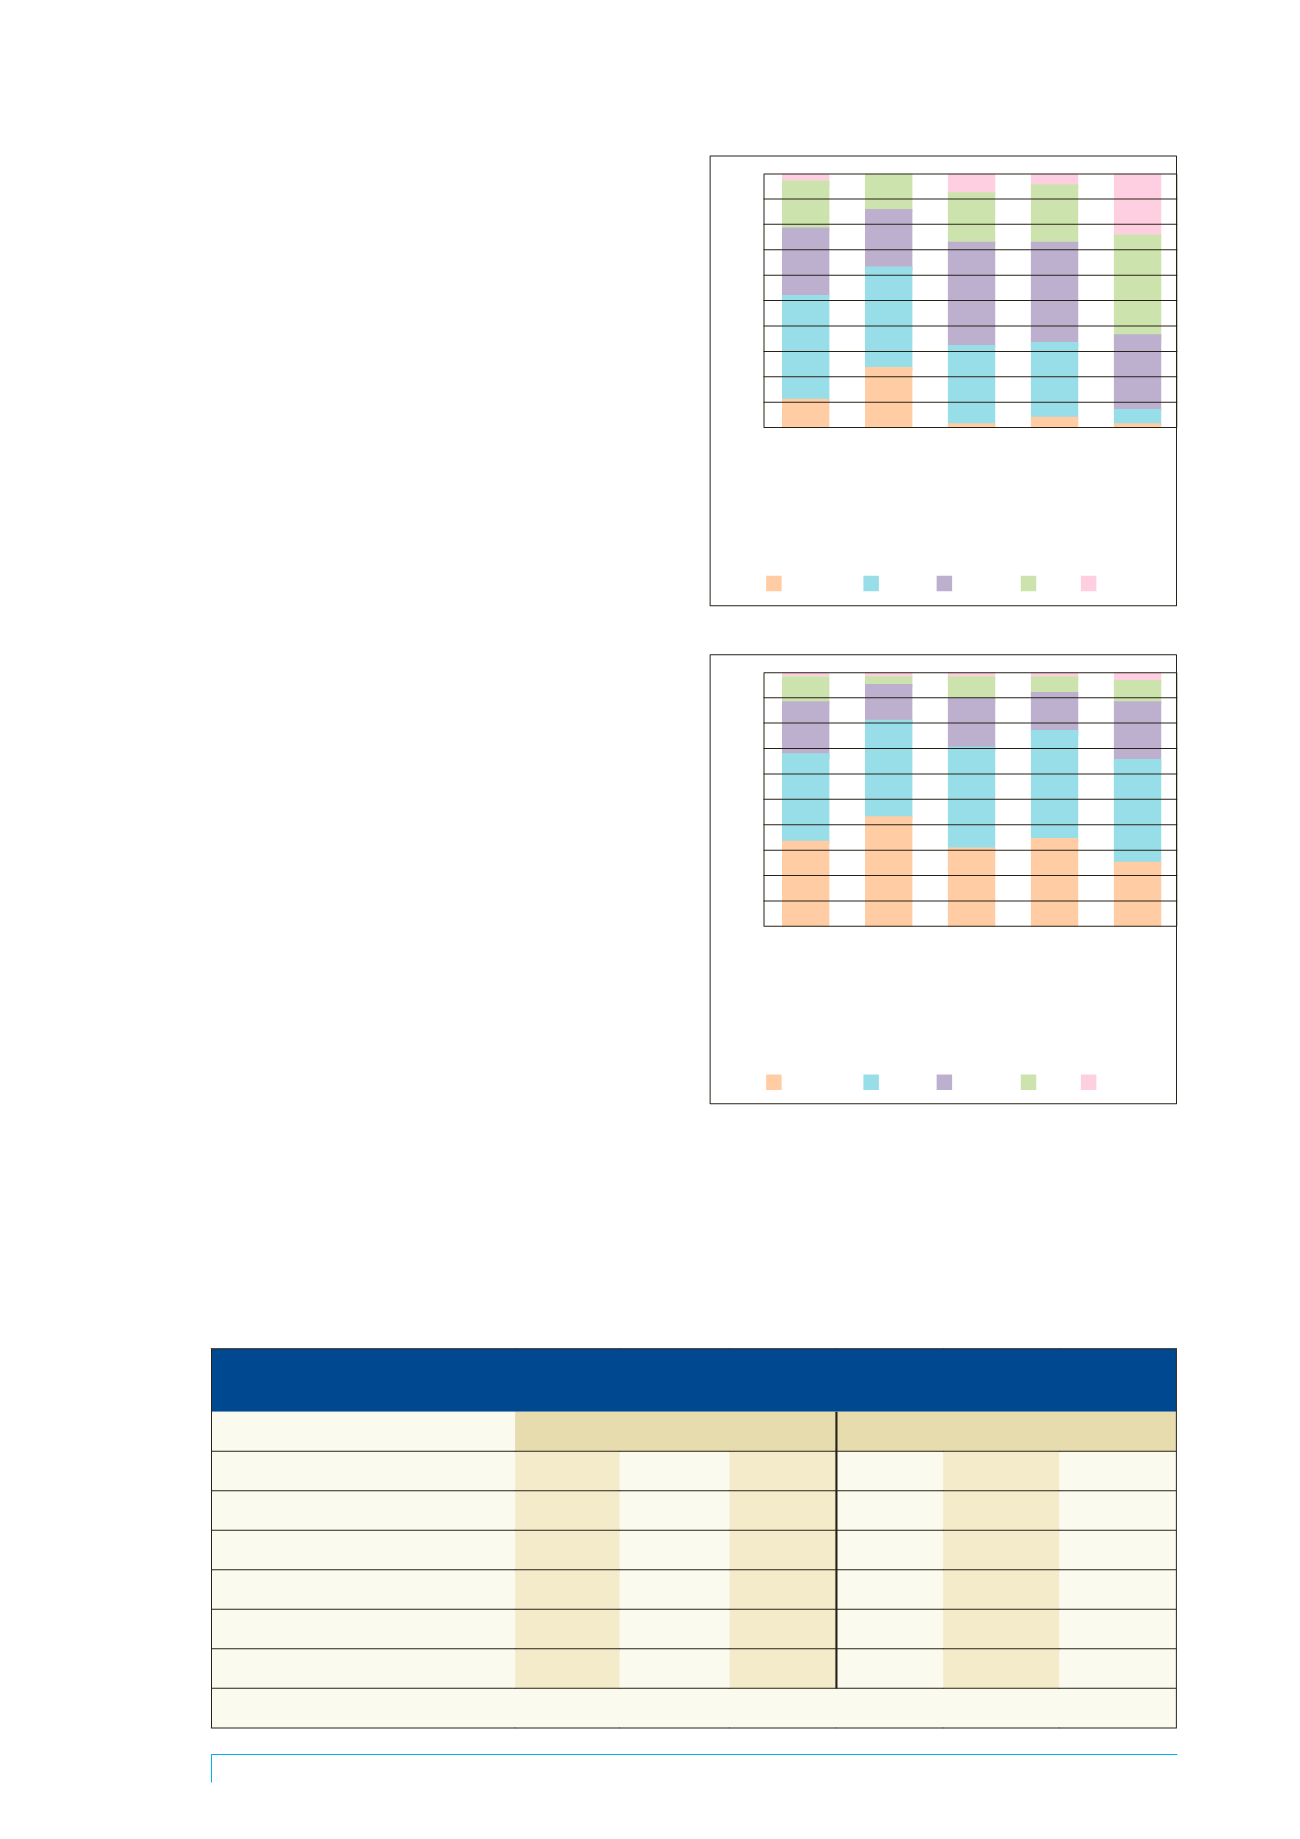
With respect to their knowledge and skills, over half the
participants indicated having less than adequate (i.e., very
limited or limited) knowledge regarding the impact of
aphasia on the neurolinguistic basis of bilingual processing
(52%) and the impact of aphasia on linguistic systems other
than English (63%). A smaller but still sizeable proportion
reported having less than adequate knowledge and/or skills
regarding strategies for assessment (32%) and intervention
(33%). With regards to working with interpreters, the large
majority (94%) of respondents indicated having adequate to
very good level of knowledge and/or skills. Table 2 presents
a summary of the descriptive statistics for these results and
Figure 1 displays the amalgamated results.
As for the respondents’ perceptions of their university
education and training, the majority indicated receiving very
limited to limited education regarding the impact of aphasia
on neurolinguistic bases of bilingual language processing
(69%), the impact of aphasia on languages with linguistic
systems different from English (81.7%), strategies for
assessment (70.4%), strategies for intervention (77.5%),
and working with interpreters (64.3%). Table 2 provides a
Table 2. Means, standard deviations and range of scores for knowledge and/or skills and university
education levels
Knowledge and/or skill levels
Perceived university education levels
Variable
Mean
SD
Range
Mean
SD
Range
Neurolinguistic bases
2.6
1
1–5
2.09
1.03
1–5
Languages with different linguistic systems
2.3
.9
1–4
1.8
0.88
1–5
Assessment
3
.9
1–5
2.09
0.99
1–5
Intervention
2.9
.9
1–5
1.96
0.93
1–5
Interpreters
3.8
.9
1–5
2.23
1.02
1–5
SD = standard deviation
100%
90%
80%
70%
60%
50%
40%
30%
20%
10%
0%
Impact of
aphasia on
neurolinguistic
bases of
bilingual
language
processing
Impact of
aphasia on
languages
with linguistic
systems
different from
English
Strategies
for
assessment
Strategies
for
intervention
Working with
interpreters
Very limited Limited Adequate Good Very good
Figure 1. Respondents’ perceived knowledge and/or skill levels
100%
90%
80%
70%
60%
50%
40%
30%
20%
10%
0%
Impact of
aphasia on
neurolinguistic
bases of
bilingual
language
processing
Impact of
aphasia on
languages
with linguistic
systems
different from
English
Strategies
for
assessment
Strategies
for
intervention
Working with
interpreters
Very limited Limited Adequate Good Very good
Figure 2. Respondents’ perceptions of university education levels


