 www.speechpathologyaustralia.org.au
JCPSLP
Volume 17, Number 1 2015
23
having adequate policies in place might “lead to overly
stereotypical response to CALD families, everyone is an
individual and not all Arabic families require the same
approach, as don’t Chinese as don’t Caucasian”.
Sixty per cent of respondents targeted both English
and the LOTE during assessment. Thirty-six per cent
reported targeting the LOTE alone, 4% reported targeting
English alone and 46% reported targeting LOTE and
English. With respect to intervention, 46% reported
targeting LOTE alone, 41% reported targeting both the
LOTE and English, and 13% reported targeting English
alone. The majority of respondents indicated that they
very
frequently
or
frequently
identified the pattern of language
use before aphasia (91%) and client preferences (87%) to
determine which languages to target for assessment and
intervention. Fewer respondents indicated using family
member preferences (35%) and the most intact language
following aphasia (56%)
frequently
or
very frequently
. Most
respondents (76%) indicated using interpreters
very rarely
,
rarely
or
sometimes
to determine the target language.
These results are summarised in Figure 5.
Challenges and changes
When asked about the challenges they faced when working
with CALD populations, respondents noted that a lack of
regarding the impact of aphasia on neurolinguistic bases
of language processing (86%), the impact of aphasia on
linguistic systems of LOTE (87%), and assessment (83%)
and intervention (83%) strategies. Yet, the large majority
of respondents indicated either never, rarely, or very rarely
seeking PD opportunities in the same areas (60–77%).
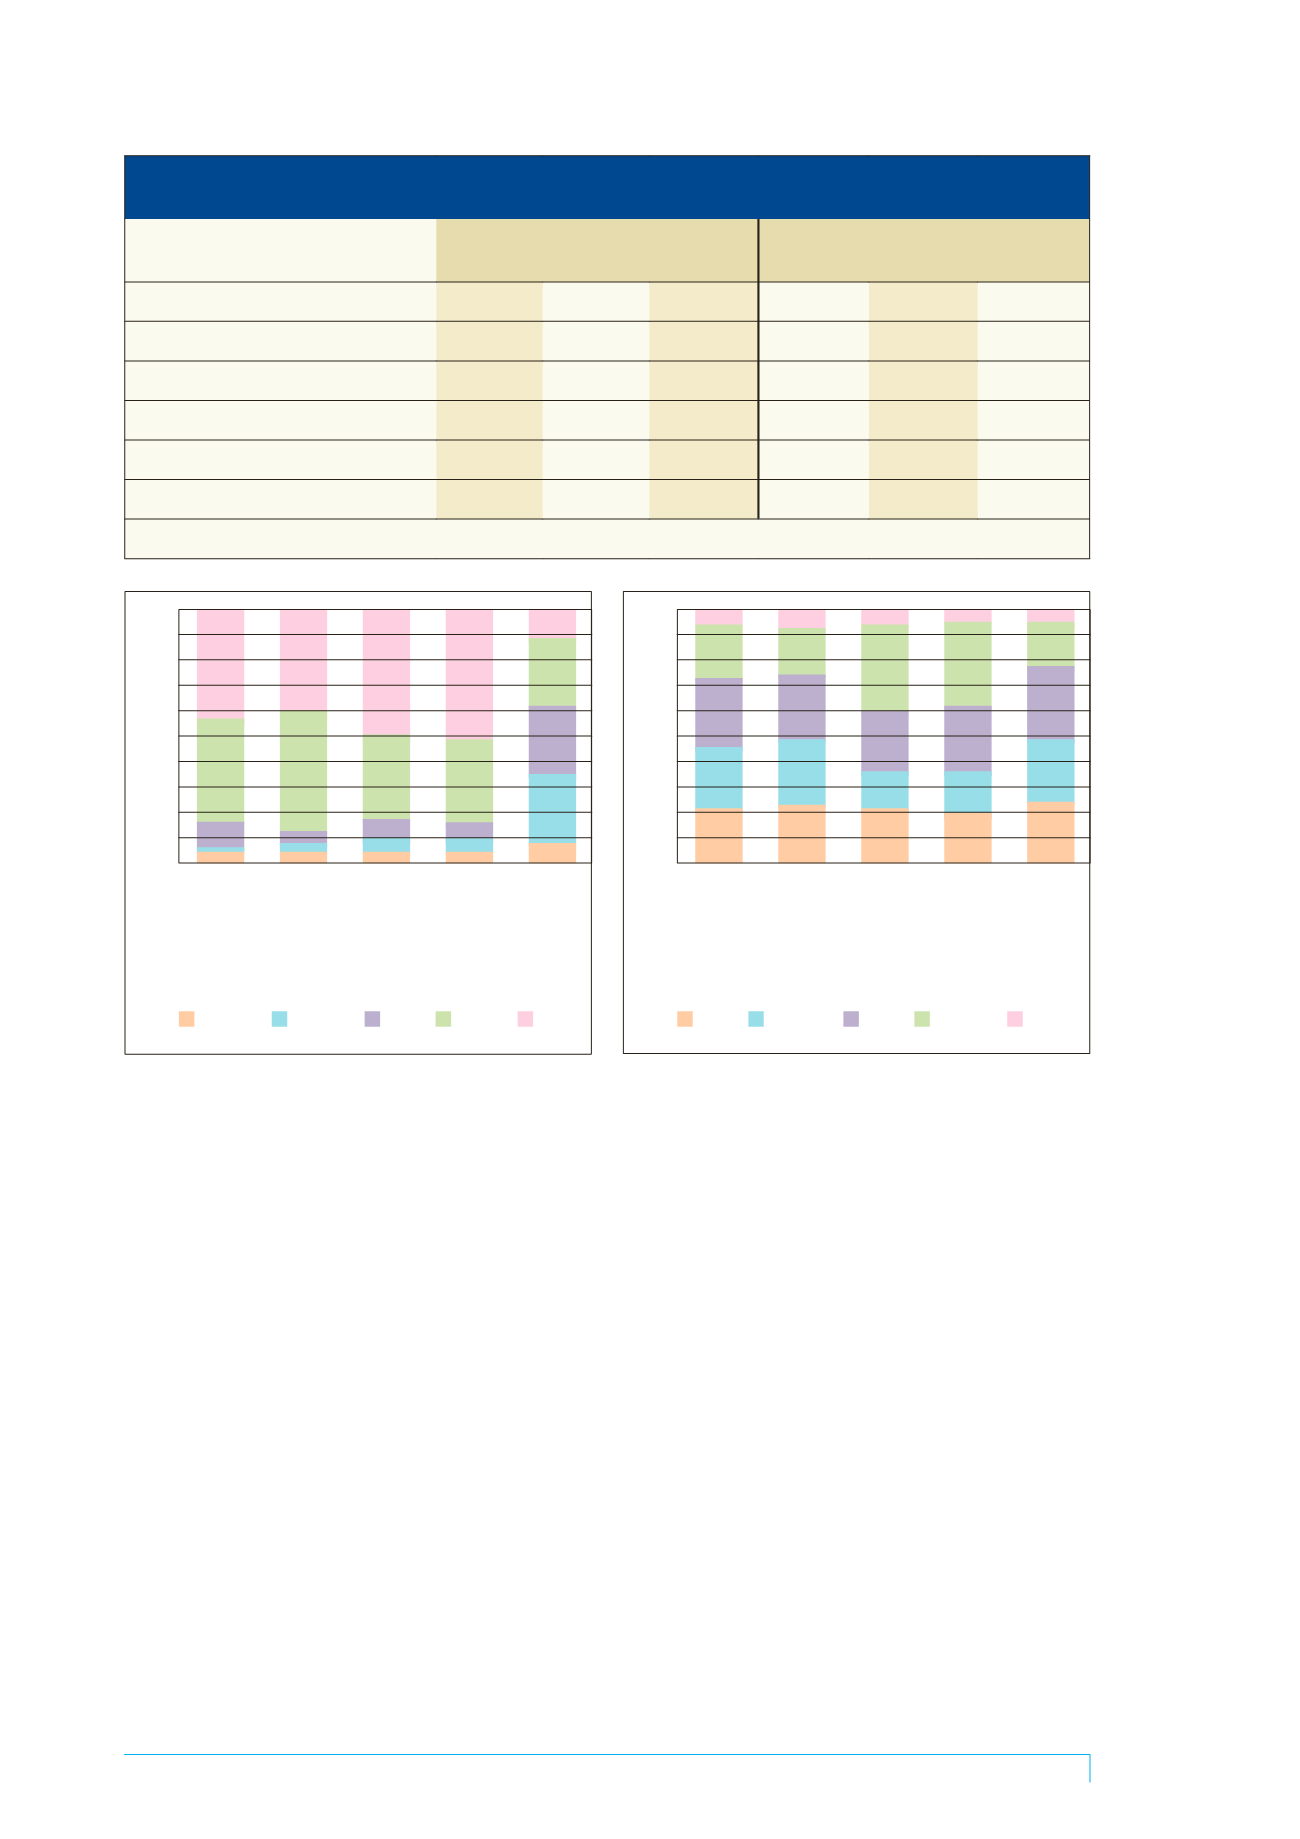
These results are summarised in Table 3 and Figures 3 and
4.
Rehabilitation practices used
Forty-one per cent of respondents reported there were no
service delivery policies in place in their current workplace
specifically regarding CALD in speech-language pathology.
Twenty-six per cent reported there were policies in place
and 33% reported not knowing whether there were policies
in place. Of the 26% who reported having policies in place,
29% reported not being able to comply with these policies.
The main reasons for non-compliance included the
respondents’ “lack of access to and availability of
interpreters”, with some specifically commenting on the
difficulty of finding interpreters familiar with the clients’
language and/or culture. The limited availability of speech-
language pathology resources and time to conduct aphasia
assessments were also reasons for non-compliance with
CALD policies. One respondent reported concerns that not
Table 3. Means, standard deviations and range of scores for interest levels in PD opportunities and
frequency levels of PD opportunities sought
Interest levels in PD opportunities
Frequency levels of which PD opportunities
are sought
Variable
Mean
SD
Range
Mean
SD
Range
Neurolinguistic bases
4.2
1
1–5
1.6
1.2
0–4
Languages with different linguistic systems
4.1
0.9
1–5
1.6
1.2
0–4
Assessment
4.2
1.1
1–5
1.9
1.3
0–4
Intervention
4.2
1.1
1–5
1.9
1.2
0–4
Interpreters
3
1.1
1–5
1.5
1.2
0–4
SD = standard deviation
100%
90%
80%
70%
60%
50%
40%
30%
20%
10%
0%
Impact of
aphasia on
neurolinguistic
bases of
bilingual
language
processing
Impact of
aphasia on
languages
with linguistic
systems
different from
English
Strategies
for
assessment
Strategies
for
intervention
Working with
interpreters
Very
uninterested
Somewhat
unintersted
Neutral
Interested Very
intersted
Figure 3. Respondents’ levels of interest in professional
development opportunities
100%
90%
80%
70%
60%
50%
40%
30%
20%
10%
0%
Impact of
aphasia on
neurolinguistic
bases of
bilingual
language
processing
Impact of
aphasia on
languages
with linguistic
systems
different from
English
Strategies
for
assessment
Strategies
for
intervention
Working with
interpreters
Never
Very rarely
Rarely
Frequently
Very
frequently
Figure 4. Frequency respondents seek professional development
opportunities


