


 42 / 88


42 |
Central Eastern Europe GRIP 2017
Figure 4.1:
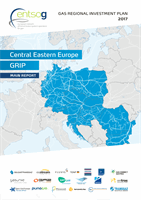
CEE Region N-1: AT
Cross-border Entry/Exit capacity 2017 (EP_IN / XP_OUT)
Cross-border Entry/Exit capacity – planned 2018-2026 (EP_IN / XP_OUT)
UGS/Production Entry Capacity (S / P) – withdrawal
UGS Exit Capacity (S_X) – injection
Domestic Exit Capacity required for Demand (D_MAX / D_AS)
AT1
Main Supply Corridor for AT
AT2
2
nd
Supply Corridor for AT
AT3
3
rd
Supply Corridor for AT
AT4
4
th
Possible Supply Corridor for AT from 2018
AT5
5
th
Possible Supply Corridor for AT from 2022
CZ
SK
HU
SI
IT
PL
BG
HR
DE
AT
RO
AT2
AT1
2020
AT2
AT2
AT2
AT5
(2022)
AT3
AT4
(2018)
4.2.1 AUSTRIA (AT)
The gas supply corridors in the following picture show the main supply corridor for
Austria, which under normal conditions runs through Ukraine and Slovakia and
through IP Baumgarten (at the figure marked AT1). Other gas supply corridors in
case of a supply disruption through Ukraine, but also under normal conditions, are
through Germany (marked AT2) and through Italy (AT3). From 2018 and 2022, two
new supply corridors for Austria can be used by commissioning two projects which
are planning to create a reverse flow capability between Slovenia and Austria, and
Hungary and Austria, respectively. The remaining gas in Austria could be used for
export to Slovakia, Hungary, Slovenia and the Czech Republic (from 2020) under a
Ukraine disruption scenario.