


 38 / 88


38 |
Central Eastern Europe GRIP 2017
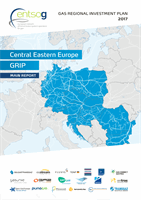
Figure 3.6:
Evolution of Disrupted Rate (DR) and Remaining Flexibility (RF),
Russian gas source disruption, Peak Day (DC), Blue Transition
2017
2020 Low
2025 Low
2025 PCI
2025 High
2020 PCI
2020 High
For technical reasons the calculation of
the Remaining Flexibility indicator could
not be calculated correctly for the disruption
of the Russian gas supply source which is
a highly extreme disruption scenario.
Remaining Flexibility (RF)
No disruption demand
0.001%< DR ≤ 5%
5% < DR ≤ 10%
10% < DR ≤ 50%
50% < DR
Disrupted Rate (DR)
3.2.3 PEAK DAY UNDER A RUSSIAN GAS SOURCE
DISRUPTION