


 47 / 88


Central Eastern Europe GRIP 2017 |
47
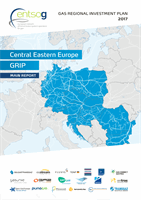
Figure 4.6:
CEE Region N-1: PL
Cross-border Entry/Exit capacity 2017 (EP_IN / XP_OUT)
Cross-border Entry/Exit capacity – planned 2018-2026 (EP_IN / XP_OUT)
UGS/Production Entry Capacity (S / P) – withdrawal
UGS Exit Capacity (S_X) – injection
Domestic Exit Capacity required for Demand (D_MAX / D_AS)
PL1
Main Supply Corridor for PL
PL2
2
nd
Supply Corridor for PL
PL3
3
rd
Supply Corridor for PL
PL4
4
th
Supply Corridor for PL
PL5
5
th
Supply Corridor for PL
CZ
SK
HU
SI
PL
BG
HR
DE
AT
RO
DK
LT
2019
2019
2019
2022
2020
PL2
PL2
PL2
PL3
PL4
PL2 / PL4
PL4
PL1
PL5
4.2.6 POLAND (PL)
The picture below illustrates the supply corridors for Poland. Under normal condi-
tions, the main supply corridors run through the LNG terminal in Świnoujście
(marked PL1), Belarus (marked PL2), and Ukraine (marked PL3). Other gas supply
corridors for Poland run through Germany (marked PL4) and the Czech Republic
(marked PL5). The commissioning of new interconnection projects with the Czech
Republic, Slovakia and Lithuania are planned in the upcoming years. A capacity
extension of the LNG terminal at Świnoujście is planned for 2020, and a new supply
corridor from Norway via Denmark is scheduled for 2022.