


 57 / 88


Central Eastern Europe GRIP 2017 |
57
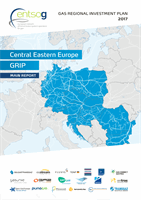
Figure 4.11:
Direction of gas flow considered at interconnection points at Polish borders under a
disruption via Belarus
Cross-border Entry/Exit capacity 2017 (EP_IN / XP_OUT)
Cross-border Entry/Exit capacity – planned 2018-2026 (EP_IN / XP_OUT)
UGS/Production Entry Capacity (S / P) – withdrawal
UGS Exit Capacity (S_X) – injection
Domestic Exit Capacity required for Demand (D_MAX / D_AS)
2017
2020
2025
Direction of gas flow:
CZ
SK
HU
SI
IT
PL
BG
HR
DE
AT
RO
GR
DK
2020
2021
2018
2019
2021
2020
2023
2018
2023
2020
2021
2024
2021
2019
2019
2019
2022
2020
2023
2019
Disrupted connection (BY)
Disrupted connection (BY)
Disrupted connection (BY)
LT
The analysis for the 2017, 2020, and 2025 summer periods did not identify any
problem with covering the average summer domestic demand and to meet the
injection requirements of underground storage facilities in the whole CEE region.