


 3 / 155

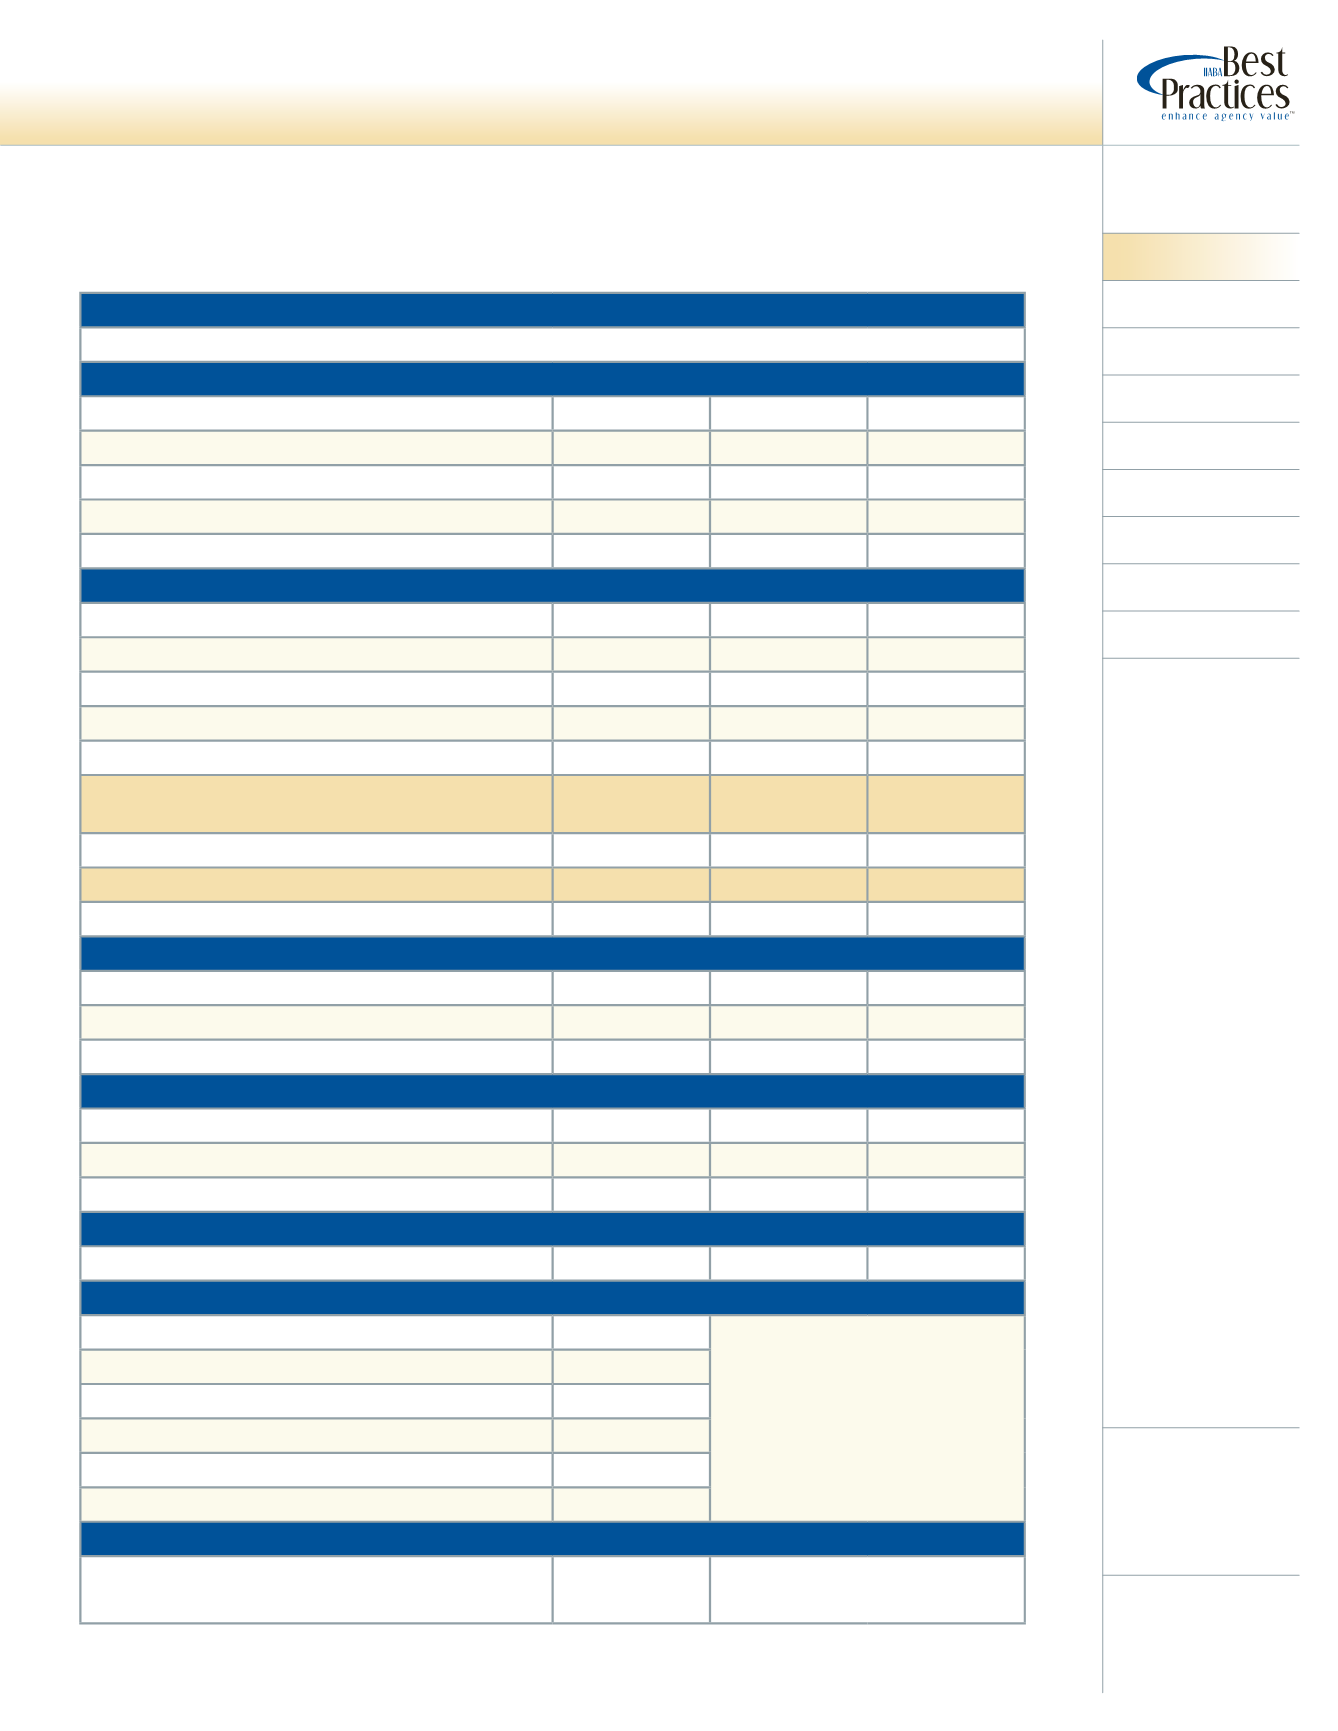
Analysis of Agencies with Revenues Under $1,250,000
Key Benchmarks
Profile
Revenues
Expenses
Profitability
Employee Overview
Producer Info
Staff Service Info
Technology
Insurance Carriers
Appendix
3
2011 Best
Practices Study
Agencies with
Revenues
Under
$1,250,000
A. Average Total Revenues: $783,786
B. Population Density of Metropolitan AreasWhere Home Office is Located
Average
+25% Profit
+25% Growth
Less than 50,000
48
48.6%
42.6%
43.9%
50,000 – 250,000
27.0%
27.7%
28.1%
250,000 – 1,000,000
13.5%
17.0%
17.5%
More than 1,000,000
10.8%
12.8%
10.5%
C. Corporate Structure
C
36.1%
34.8%
34.5%
S
50.0%
50.0%
47.3%
Partnership
2.8%
2.2%
3.6%
LLC
8.3%
10.9%
12.7%
Sole Proprietorship
2.8%
2.2%
1.8%
Average Number of Agency Locations
(Main Offices and Branch Offices)
1.4
1.1
1.6
# of States Offices are Located in
1.0
1.1
1.1
Agency has an ESOP
0.0%
0.0%
0.0%
% of Stock Owned by ESOP
0.0%
0.0%
0.0%
D. Shareholders
Number of Shareholders (excluding ESOP)
1.9
2.3
2.0
High
6.0
Low
1.0
E. Ownership Percentage
% Owned by Largest Shareholder
79.2%
71.6%
86.3%
High
100.0%
Low
30.0%
F. Shareholder Age
Current Age of Largest Shareholder
52.2
51.6
51.6
G. Parent Corporation
Average
“Other” included
Holding Company.
% of Agencies Owned by Another Corporation
5.6%
Description of Parent Corporation
Financial Institution
50.0%
National Broker
0.0%
Other
50.0%
H. Member of Group
% of Agencies Belonging to a Franchise, Cluster,
Alliance/Network or Aggregator Group
32.4%
“Groups”consisted of Georgia Agency Partners, 3-S Group, Smart
Group, LLC, Shared Agency Services, Consolidated Agencies,
LLC, Northern New England Insurance Group, Iroquois, Stateline
Group, SIAA, and Pacific Interstate Insurance Brokers.
Profile
(of Agencies in this Study Group)