


 6 / 155

Key Benchmarks
Profile
Revenues
Expenses
Profitability
Employee Overview
Producer Info
Staff Service Info
Technology
Insurance Carriers
Appendix
6
Analysis of Agencies with Revenues Under $1,250,000
2011 Best
Practices Study
Agencies with
Revenues
Under
$1,250,000
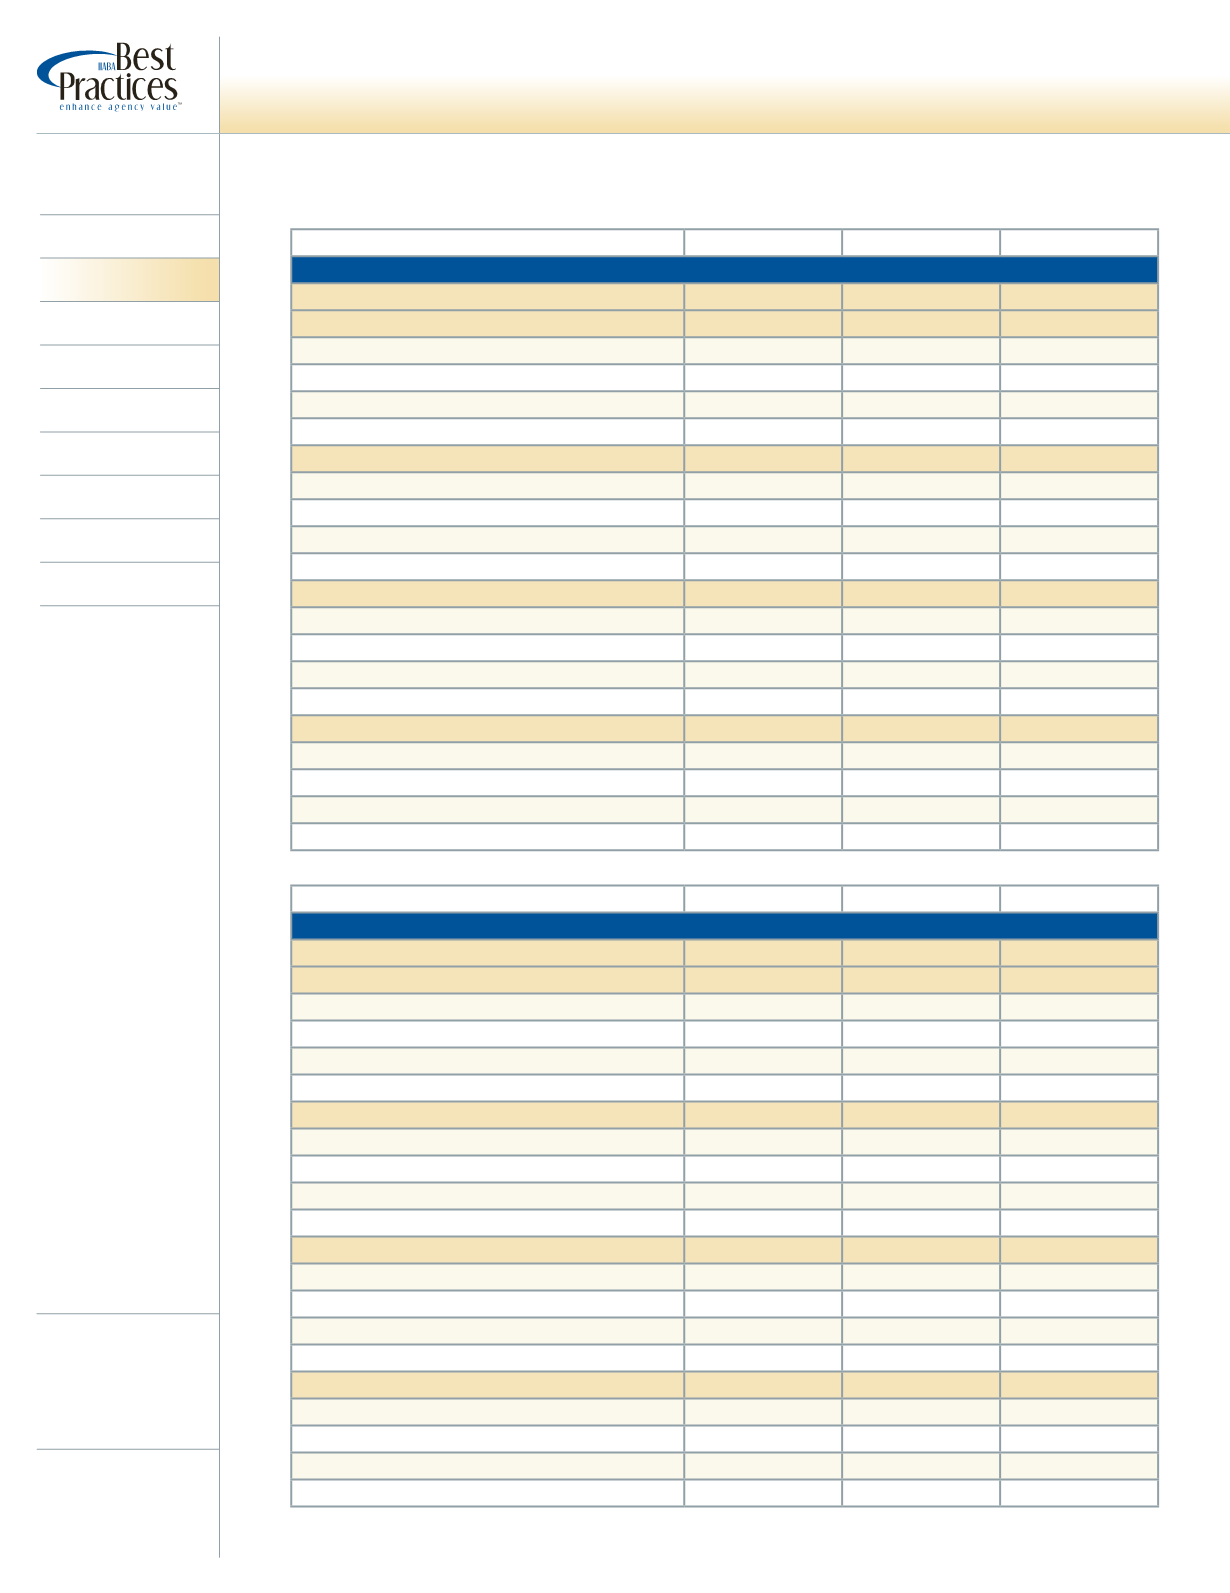
Revenue by Account Size
(as measured by Comm. & Fees – not premium)
Average
+25% Profit
+25% Growth
Commercial P&C
Total Commissions & Fees in Book
$321,347
$346,160
$336,537
Greater than $25,000
% of Book
12.3%
20.5%
16.8%
# of Accounts
2.4
2.8
2.7
Total Revenue
$104,607
$177,800
$187,985
Revenue per Account
$43,073
$64,655
$70,494
Between $10,000 and $25,000
% of Book
14.4%
17.1%
14.4%
# of Accounts
6.8
8.7
8.2
Total Revenue
$81,417
$98,728
$97,042
Revenue per Account
$12,041
$11,392
$11,834
Between $5,000 and $10,000
% of Book
19.2%
23.4%
16.9%
# of Accounts
14.5
17.6
11.4
Total Revenue
$88,028
$115,857
$81,271
Revenue per Account
$6,071
$6,593
$7,111
Less than $5,000
% of Book
54.1%
38.9%
51.9%
# of Accounts
531.7
333.8
485.7
Total Revenue
$229,531
$168,378
$249,615
Revenue per Account
$432
$505
$514
(as measured by Comm. & Fees – not premium)
Average
+25% Profit
+25% Growth
Group L&H/Financial
Total Commissions & Fees in Book
$47,527
$92,118
$16,157
Greater than $25,000
% of Book
19.7%
15.5%
18.6%
# of Accounts
1.7
1.3
*
Total Revenue
$57,595
$47,667
*
Revenue per Account
$34,557
$35,750
*
Between $10,000 and $25,000
% of Book
16.4%
15.6%
18.6%
# of Accounts
3.1
3.3
*
Total Revenue
$41,317
$48,000
*
Revenue per Account
$13,146
$14,400
*
Between $5,000 and $10,000
% of Book
21.3%
18.8%
28.2%
# of Accounts
5.6
9.0
4.0
Total Revenue
$37,392
$57,667
$22,800
Revenue per Account
$6,677
$6,407
$5,700
Less than $5,000
% of Book
42.4%
50.1%
39.0%
# of Accounts
30.2
33.4
27.8
Total Revenue
$41,378
$65,883
$12,593
Revenue per Account
$1,369
$1,971
$453
*Insufficient Data