


 10 / 232

10 |
Ten Year Network Development Plan 2015
0
2,000
1,000
3,000
4,000
5,000
7,500
6,500
6,000
1,500
500
2,500
3,500
4,500
5,500
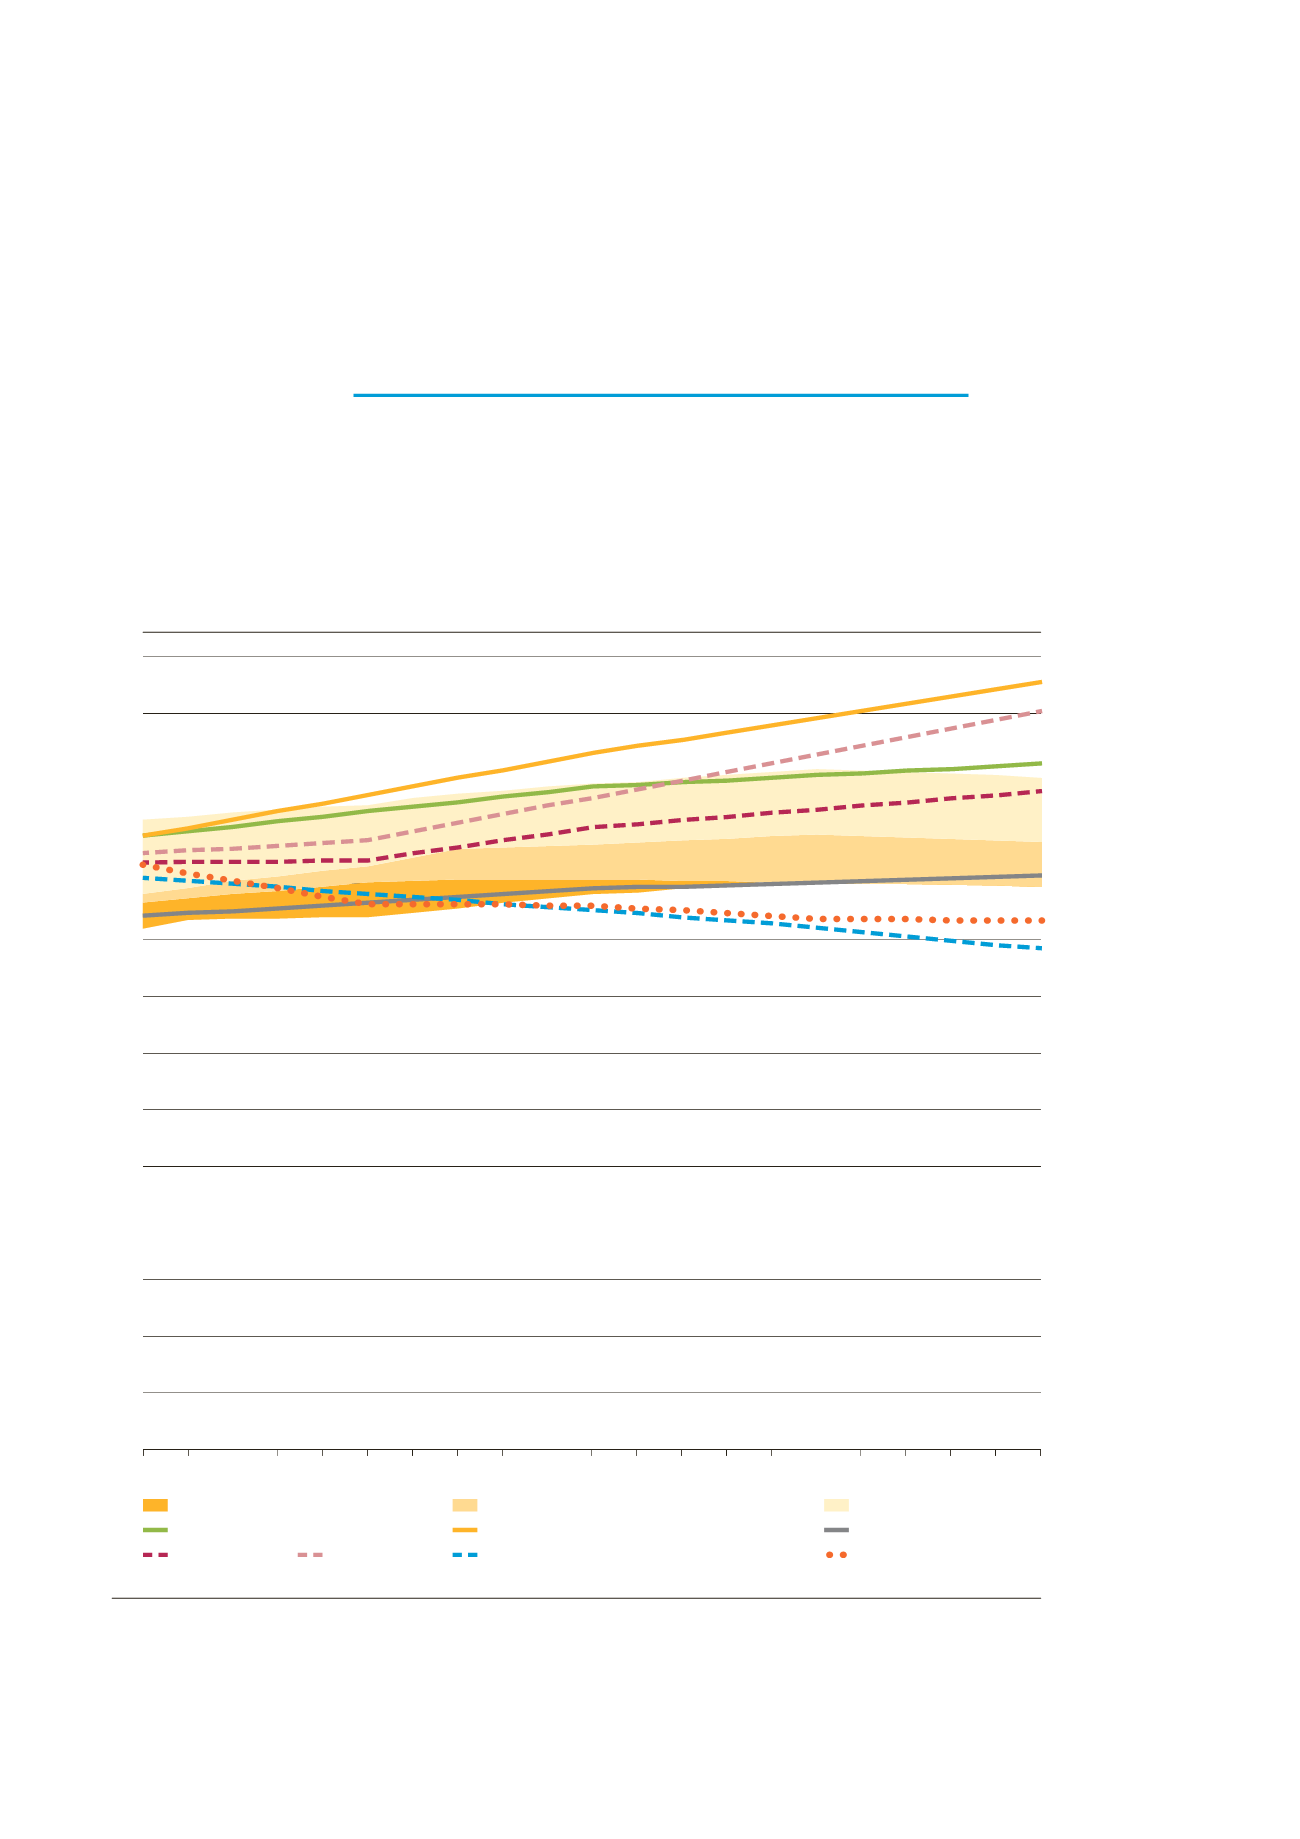
TWh/y
2015 2016 2017 2018 2019 2020 2021 2022 2023 2024 2025 2026 2027 2028 2029 2030 2031 2032 2033 2034 2035
ENTSOG lower range
ENTSOG range under TSOs scenarios (final+power)
ENTSOG upper range
Eurogas: Base (EU-28 adapted)
IEA NPS
IEA CPS
IEA 450 S
DGENER trends to 2050
Eurogas: Envt. (EU-28 adapted)
Eurogas: Slow Dev. (EU-28 adapted)
Figure 3:
Comparison of gas demand outlooks
such as the socialization of cost or co-financing, and can lead to a higher risk of
stranded assets.
One of the main reasons for this lack of market commitment is the uncertainty in the
long term use of gas in definition of the European energy mix. Only a relative small
share of investment can be triggered for security of supply reason. Market players,
NRAs and infrastructure operators need the guarantee of sufficient use of the infra-
structure in order to support the economically efficient development of projects.
A STABLE DEMAND DRIVEN BY GLOBAL CONTEXT
Since 2010 European gas demand has continuously decreased mainly due to a low-
er use of gas-fired power generation. This results from the combination of European
policies, such as the development of renewable sources (RES) and an inefficient
European Trading System (ETS), as well as the global context of low coal prices and
still ongoing economic downturn.