


 12 / 232

12 |
Ten Year Network Development Plan 2015
0
4,000
5,000
2,000
6,000
3,000
1,000
7,000
8,000
9,000
TWh/y
0
500
300
100
200
700
600
400
800
900
bcma
2015
2016
2017
2018
2019
2020
2021
2022
2023
2024
2025
2026
2027
2028
2029
2030
2031
2032
2033
2034
2035
Maximum (Low infra. Sc)
Maximum (High infra. Sc)
Intermediate (Low infra. Sc)
Minimum (Low infra. Sc)
Green
Grey
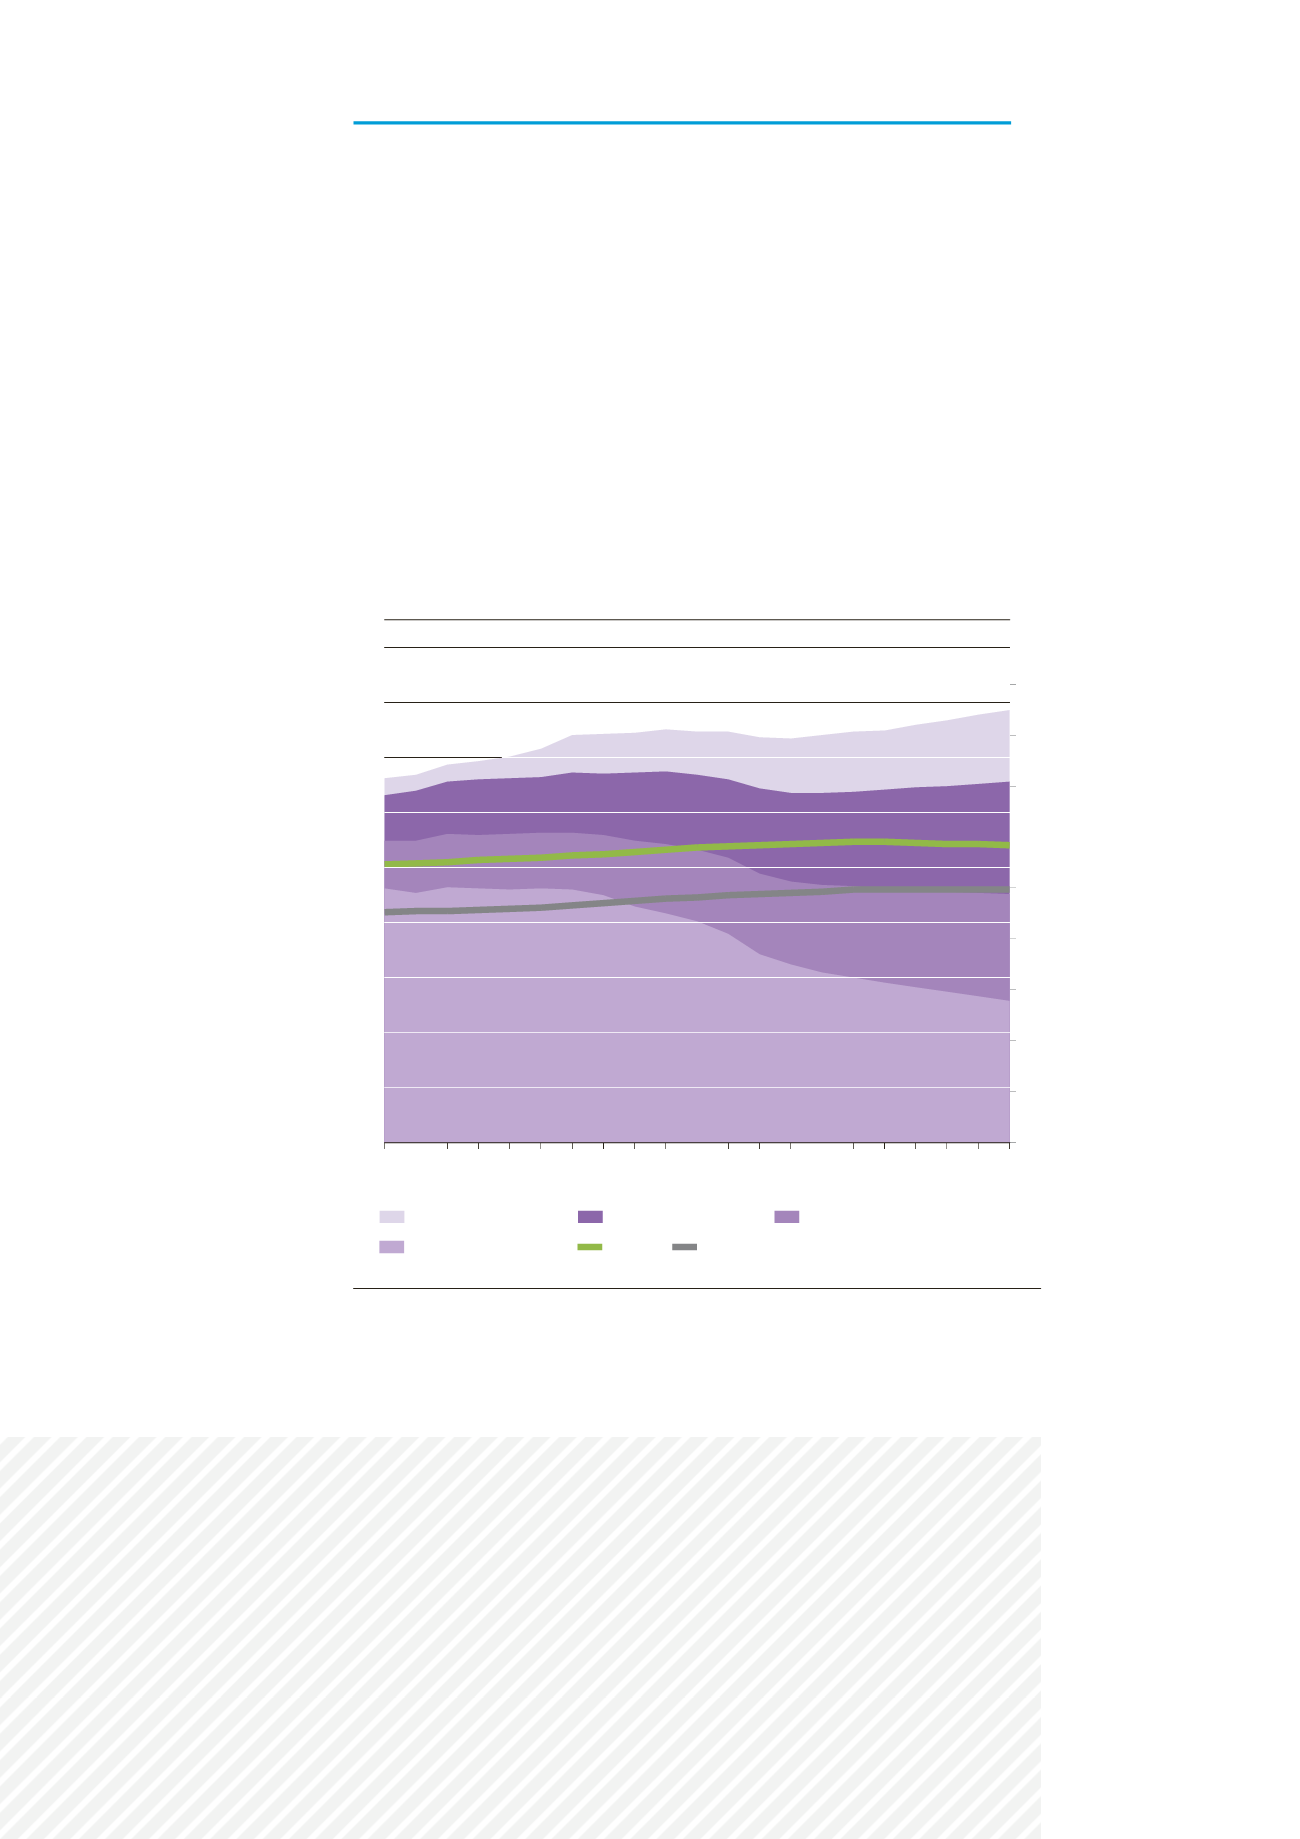
Figure 5:
Comparison of gas demand and gas supply scenarios
EUROPE NEEDS TO ENLARGE ITS SUPPLY PORTFOLIO
When gas demand does not show a clear evolution, the requirements for gas imports
are driven by the decreasing indigenous production. Under the current perspective
the induced need for additional imports is likely to be met by Russian gas and LNG,
especially under the Green scenario. In such a situation Europe would be in a
challenging position resulting in a reduced market power.
Other sources are likely to stay at the current level (pipe gas from Algeria and Libya)
or would only have a limited influence (Caspian gas) in absence of stronger market
signals. Norway is a very particular case as there is a potential to deliver significant
volumes from the Barents Sea gas fields from the mid 2020s. Nevertheless, the
investments connecting this production to the existing European gas network is not
yet decided and is in competition with potential LNG developments as a result of the
lack of long term attractiveness of the continent. Other producers (e. g. North Africa
and Middle-East) are facing the same challenges. Appropriate signals from Europe
would enable the delivery of new supply to Europe improving both its energy security
and its competitiveness while supporting high environmental standards.