


 11 / 232

Ten Year Network Development Plan 2015 |
11
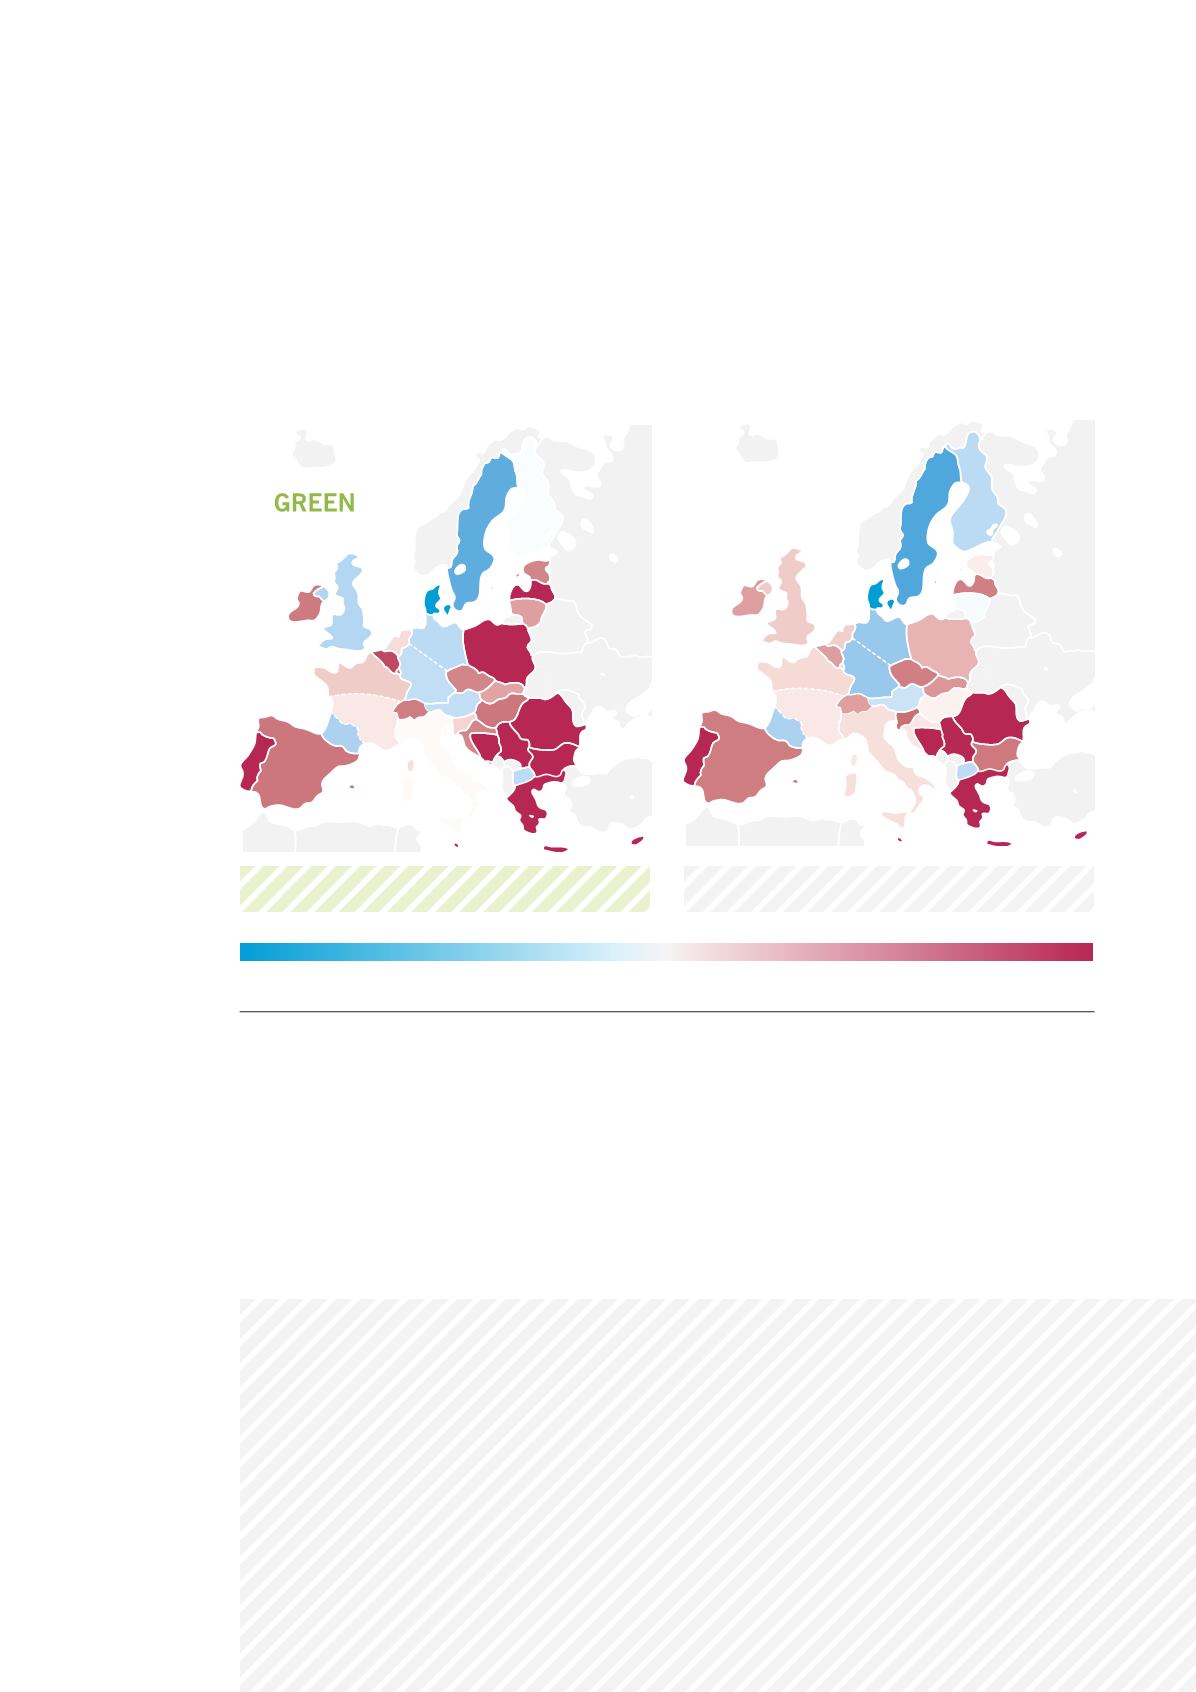
> -50%
> 50%
0%
GREY
> -50%
> 50%
0%
GREY
> -50%
> 50%
0%
Figure 4:
Evolution of total annual gas demand on 2015 – 2035 period
(Gas demand for electricity is based on data from ENTSO-E SO&AF 2014 – 2030)
The TYNDP assessment indicates that over the next two decades the evolution of
gas demand is likely to be driven mostly by the use of gas in the power generation
sector. Therefore, most gas demand outlooks evolve in a narrow range which
depends on the equilibrium between gas, coal and CO
2
prices. The most divergent
scenarios are the “DGENER trends to 2050” and the “IEA 450 S” where environ-
mental targets are achieved with a higher level of RES and a better efficiency.
This overall slow increase of gas demand (0.4% per annum on the next twenty-one
years) hides a heterogeneous situation among countries. This is particularly the case
in the Green scenario due to very different national strategy to achieve environmen-
tal targets.
ENTSOG is now deriving the level of gas demand for power generation based on
ENTSO-E and price data. The seasonal swing is now modelled through the use of
summer and winter cases. E NTSOG has kept the 1-day Design Case and the 2-week
Uniform Risk Case representing the extreme situation to be covered by the Europe-
an gas system.