


 36 / 232

36 |
Ten Year Network Development Plan 2015
Image courtesy of Energinet DK
0
1,000
2,000
3,000
4,000
5,000
6,000
2001
2002
2003
2005
2004
2006
2007
2008
2009
2010
2011
2012
2013
TWh
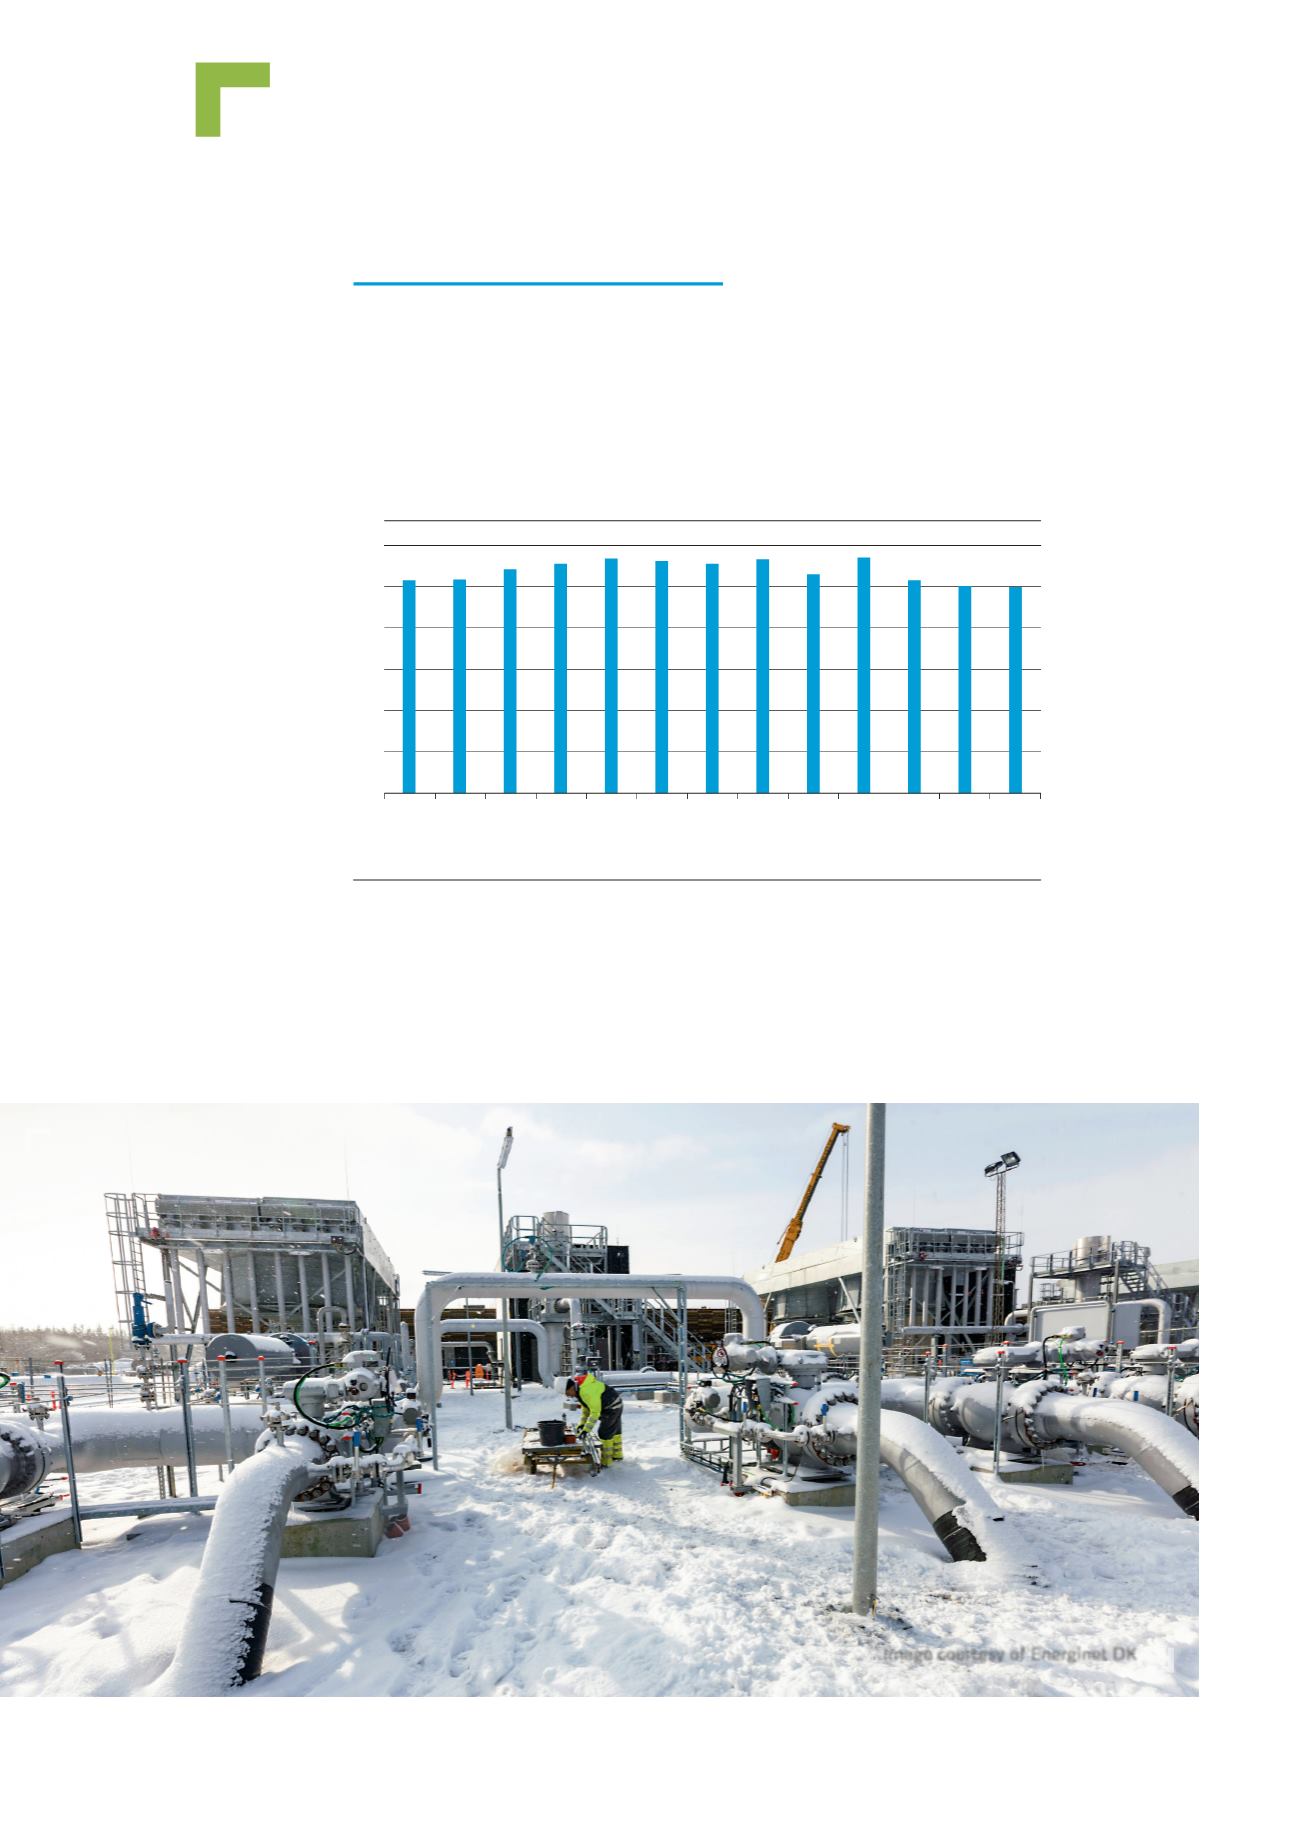
Figure 4.1:
Evolution of European gas consumption
(Source converted from Eurostat figures)
4.2 Current state
4.2.1 YEARLY DEMAND EVOLUTION
The level of gas demand in Europe has been influenced by the development of the
gas market and the specific climatic conditions over the years. Energy and environ-
mental policies, the economic crisis and commodity prices have pushed gas
demand back to the 2001 level. The projected evolution of demand for the different
gas demand sectors and for the different countries is explored in this chapter.