


 23 / 88

ECONOMIC REPORT 2015
23
5.1 Cost Growth
As the UKCS evolves, it is inevitable that the costs of
operating the basin and developing new opportunities
will become an increasingly significant factor in its
competitiveness, particularly as production declines
from maturing fields and the size of new discoveries get
smaller over time.
Cost growth on the UKCS, particularly since 2010,
has been significantly higher than in other oil and gas
provinces, including those around the North Sea. At
the start of 2014, even with oil prices above $100, it
had become apparent that the UKCS would become an
increasingly uncompetitive destination for investment
unless actionwas taken to address inflationary pressures
and significantly improve the cost and efficiency
of operations.
In response, Oil & Gas UK commissioned fresh studies
to examine the drivers behind the rise in costs on the
UKCS, working with a range of organisations including
McKinsey. This analysis showed that capital costs
per barrel of oil equivalent (boe) had increased by
18 per cent from 2004 to 2013 on a compound annual
growth rate (CAGR) and operating costs per boe had
risen at a 12 per cent CAGR. In both instances, the
growth reflected the trend of declining volumes in
both new and existing assets coupled with general cost
increases in activities.
The rise in costs has been evident across fields of all
ages and in all regions of the UKCS, although costs
have been better controlled in the southern North Sea
(SNS). It appears to be driven by three factors: increased
commodity costs driving up unit costs; growth in
activity (both in the UK and overseas) resulting in
0
5
10
15
20
25
2000 2001 2002 2003 2004 2005 2006 2007 2008 2009 2010 2011 2012 2013 2014
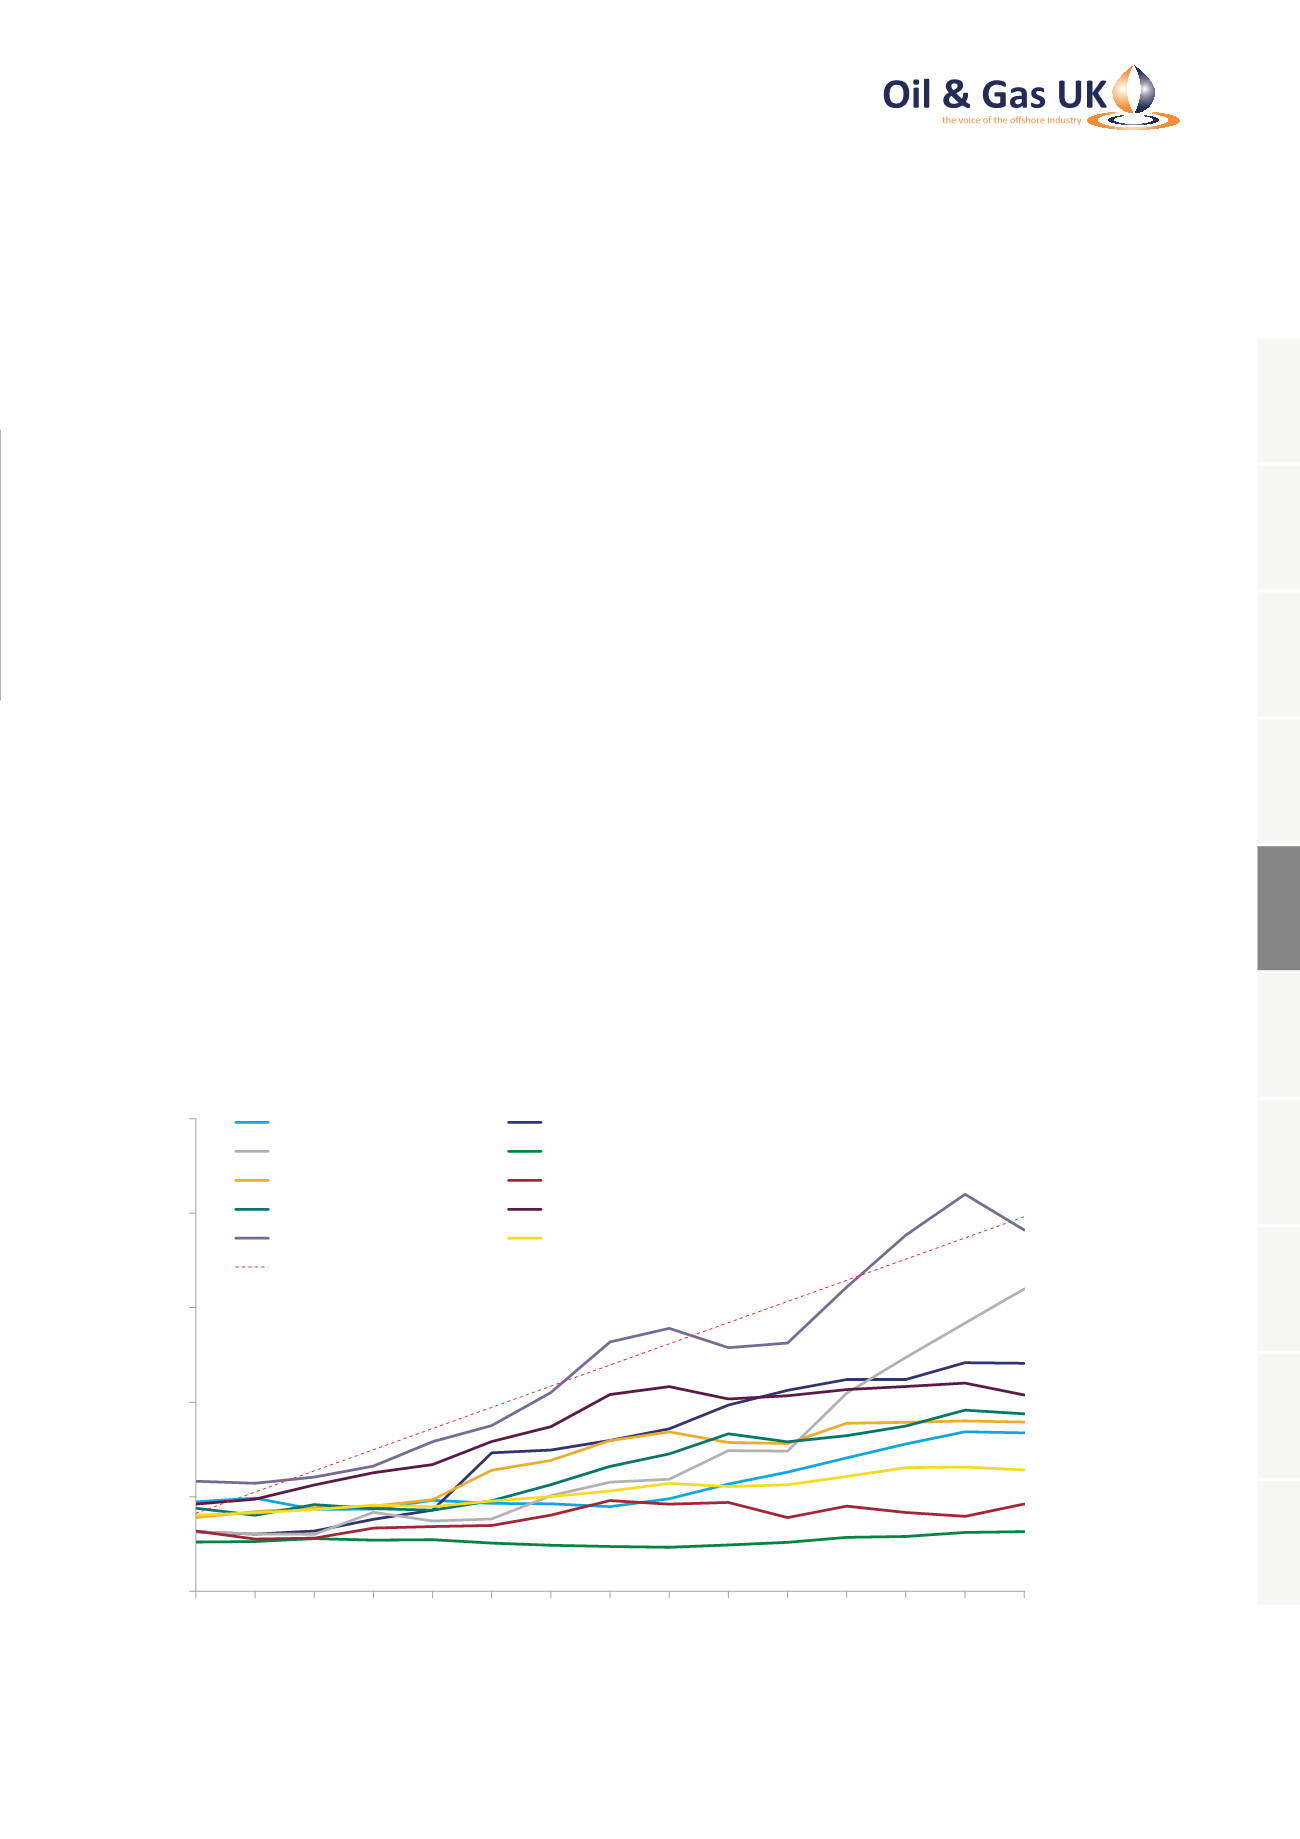
Average Lifting Cost/boe ($)
Angola
Brazil
Denmark
Egypt
Indonesia
Netherlands
Nigeria
Norway
UK
US (Gulf of Mexico Deepwater)
Linear (UK)
Source: Wood Mackenzie
Figure 10: Weighted Average Lifting Costs for UK and Other Regions
5. Maintaining Competitiveness –
Seizing the Cost and Efficiency Challenge
1
2
3
4
5
6
7
8
9
10