


 19 / 88

ECONOMIC REPORT 2015
19
4.1 Capital Investment Cuts and Cost Deflation
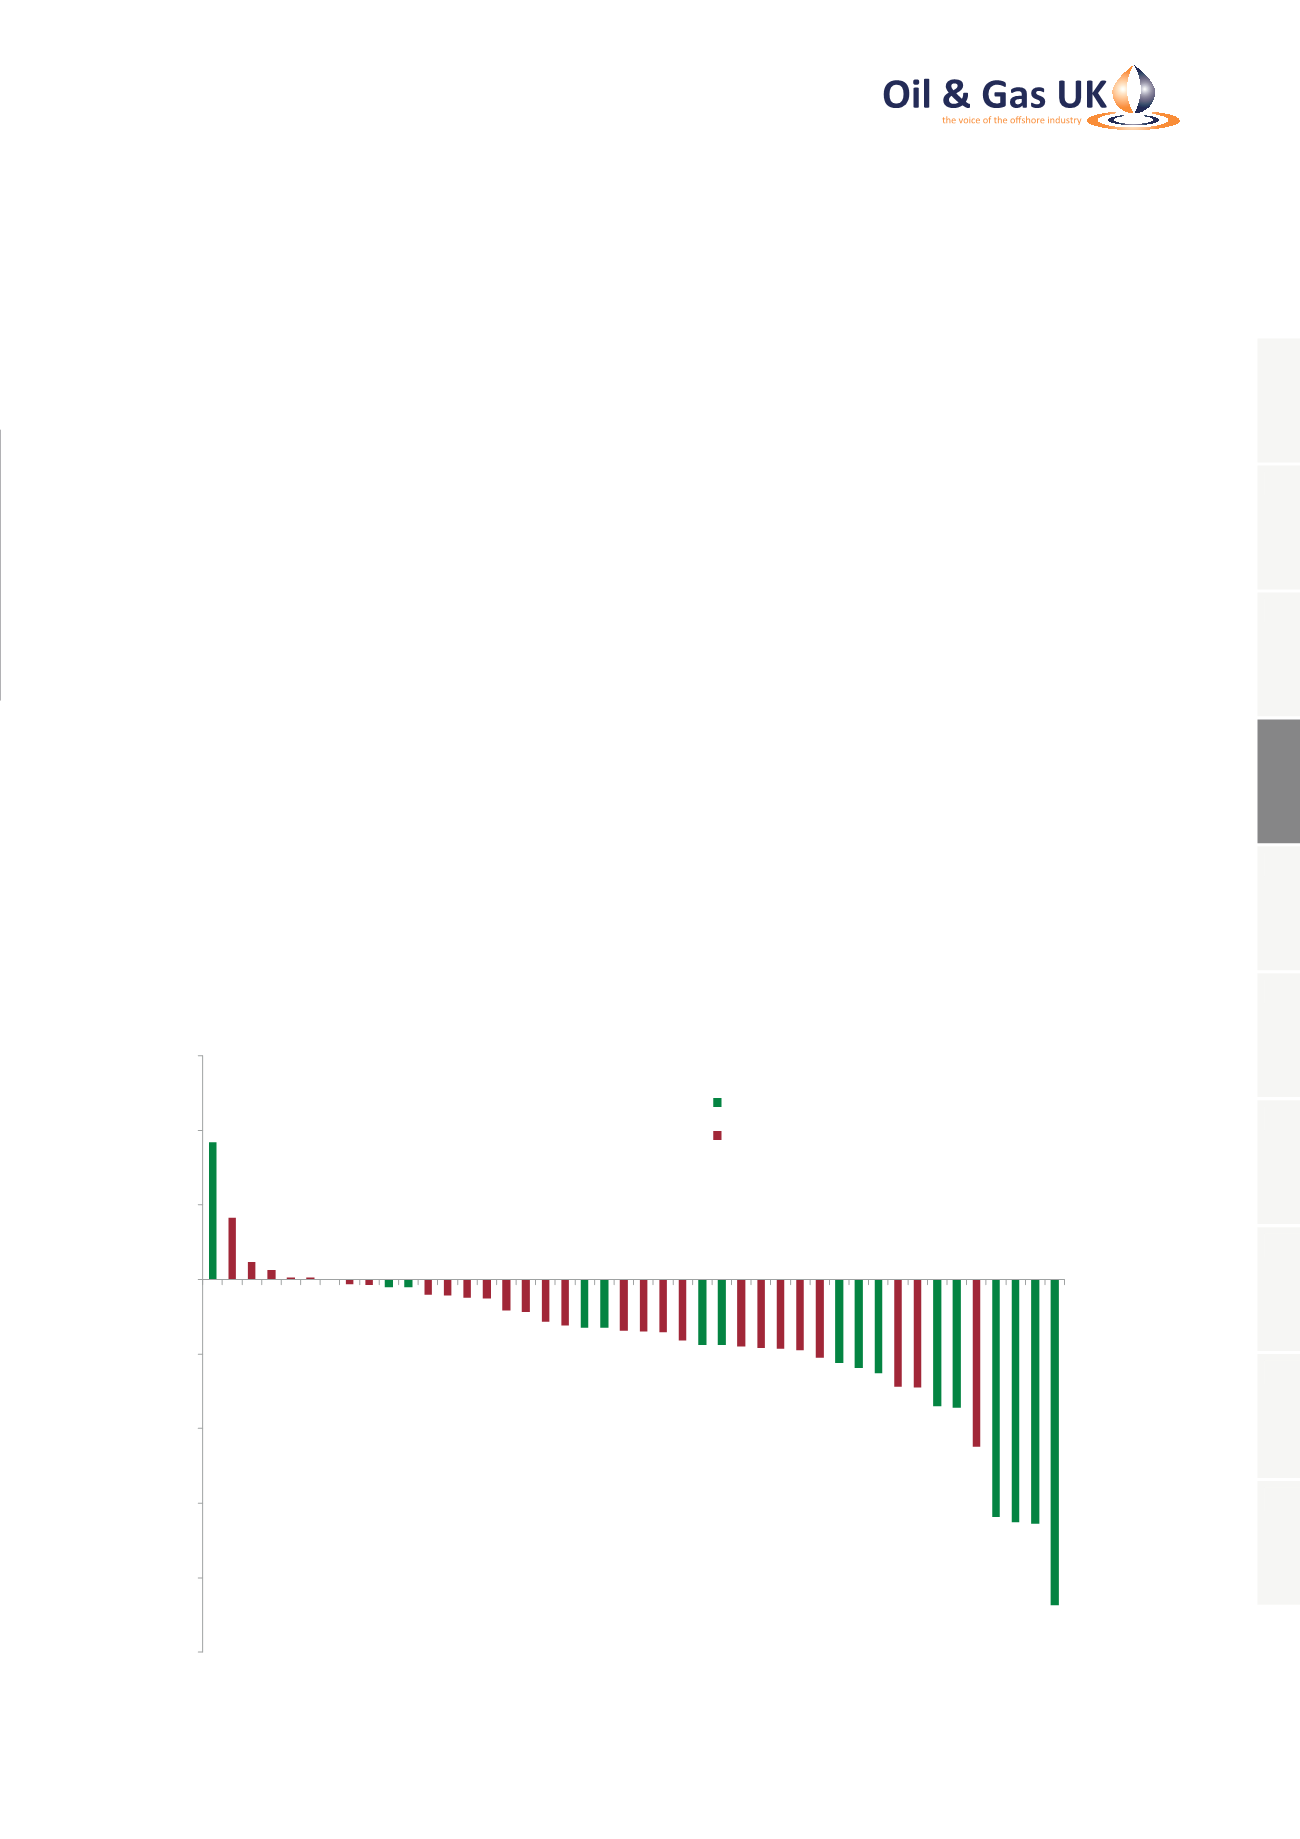
Figure 8 shows the changes in worldwide capital
budgets for oil and gas exploration and production
companies between 2014 and 2015 and illustrates
how budgets are being tightened globally and not just in
the UK.
A Wood Mackenzie survey of 44 organisations
found that each company plans to spend on average
$1.7 billion less in 2015 than they did in 2014,
representing an average fall of just over 25 per cent.
The vast majority of capital that companies still plan
to invest in 2015 is on activity already committed to
before the price fall. Although less than three per cent
of worldwide oil and gas capital is invested in the UK,
the UKCS is particularly struggling to attract discretionary
investment innewexploration, appraisal, or development
activity.
The primary reason for the global reduction in capital
investment is to restore cash flow at a time when
revenues have been negatively impacted by oil prices.
However, it is believed that investors are also postponing
investment in anticipation of further cost deflation in
the near term. For example, rig rates across the world
are falling and those for the North Sea are shown in
Figure 9 overleaf. The day-rate for semi-submersible
rigs fell by around 40 per cent from January 2014 to
-10
-8
-6
-4
-2
0
2
4
6
Change in Global Capex Budget (US$ Billion)
Companies Investing in the UKCS
Companies not Investing in the UKCS
Source:Wood Mackenzie
Figure 8: Capital Budget Changes, 2015 versus 2014
4.
Global Reaction to the Oil Price Fall
1
2
3
4
5
6
7
8
9
10