


 14 / 88

ECONOMIC REPORT 2015
14
1.20
1.30
1.40
1.50
1.60
1.70
1.80
1.90
2.00
2.10
2008
2009
2010
2011
2012
2013
2014
2015
US Dollar to UK Sterling Exchange Rate
Source:Bank ofEngland
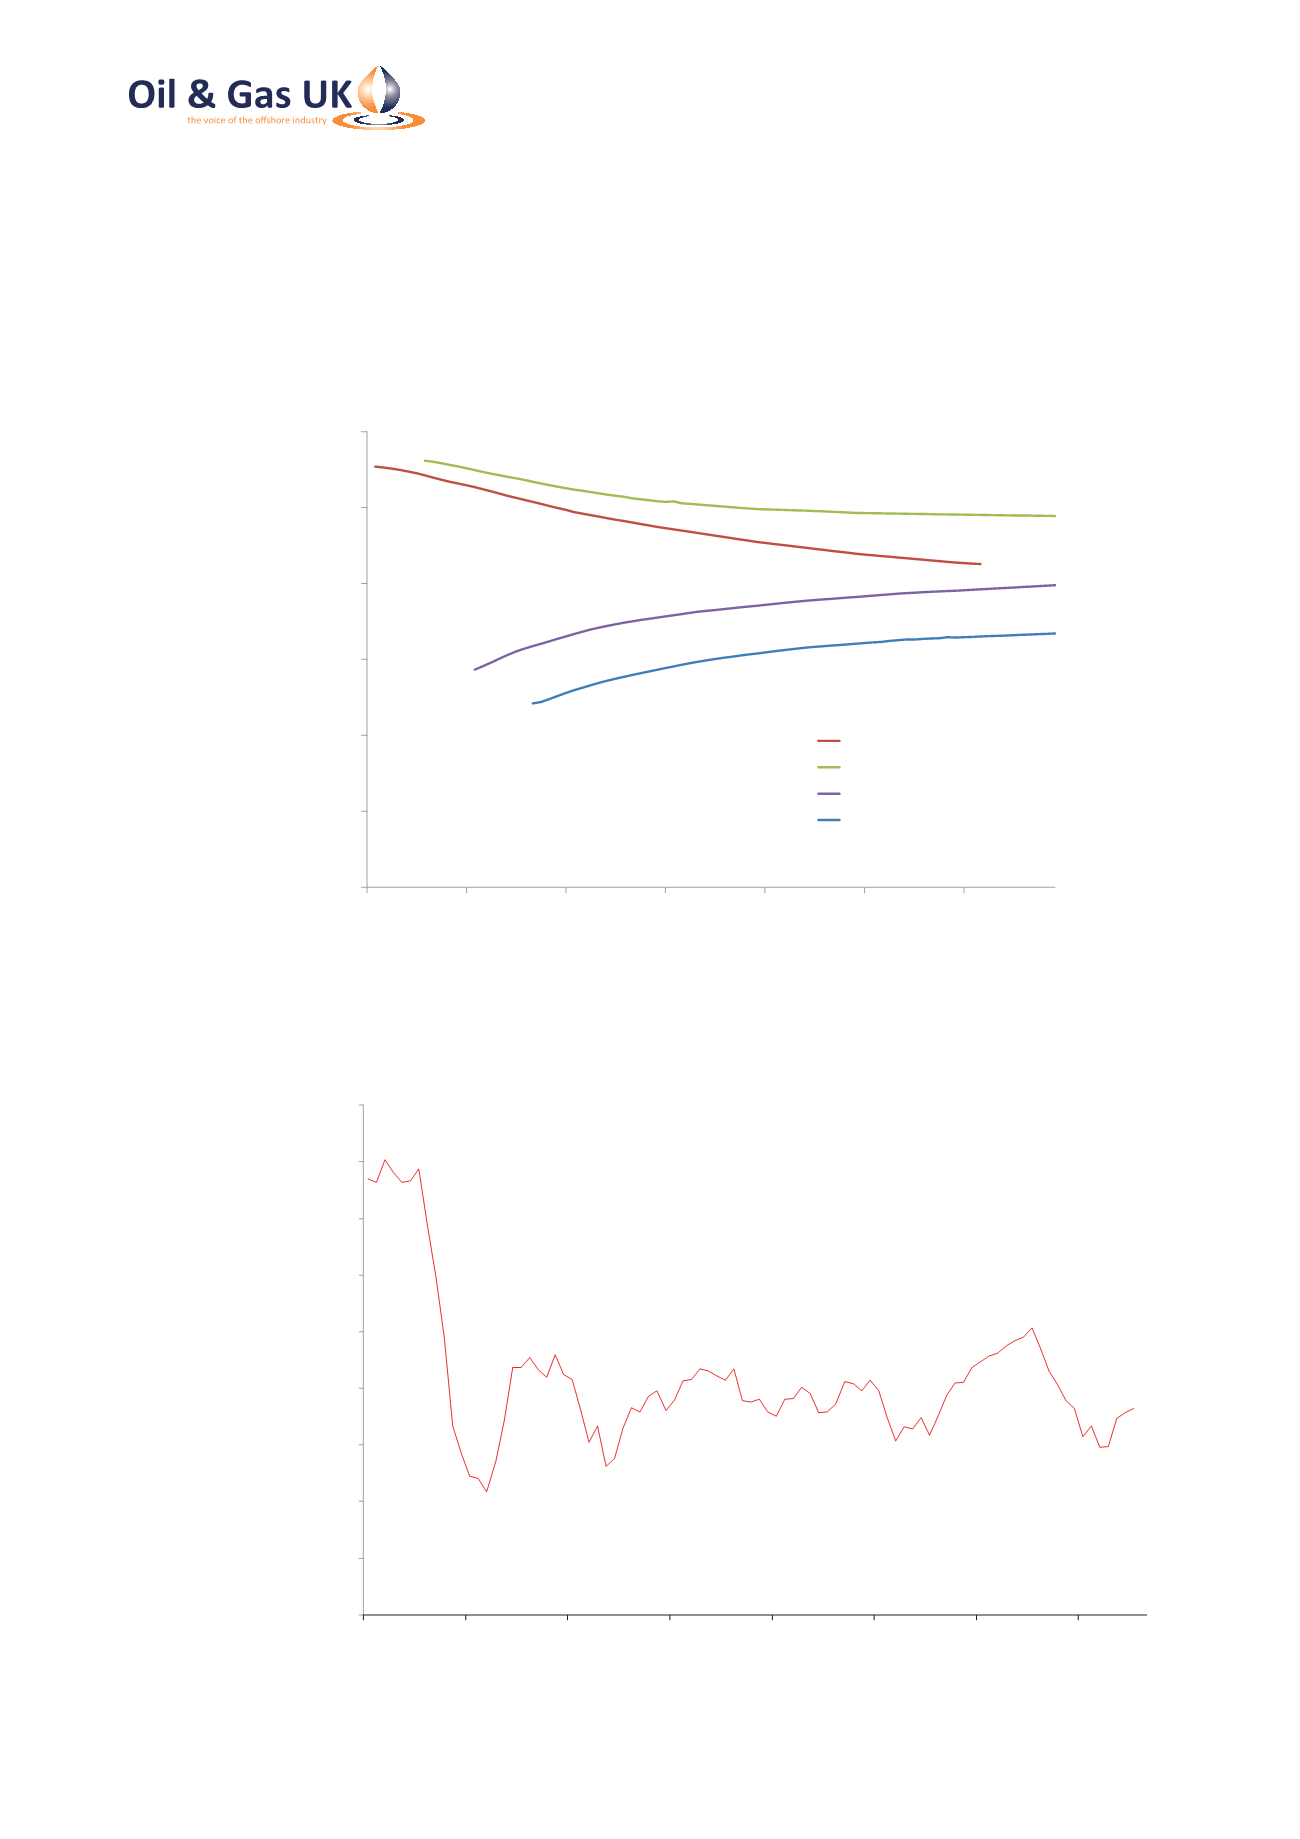
Figure 4: US Dollar-UK Sterling Spot Exchange Rate
Figure 3: Brent Futures Curves Reflect Shift in Price Expectations
0
20
40
60
80
100
120
2014
2015
2016
2017
2018
2019
2020
Brent Futures Daily Settlement Prices ($/bbl)
End December 2013
Mid 2014
End December 2014
August 2015
Source: Intercontinental Exchange