


 11 / 88

ECONOMIC REPORT 2015
11
3.1 Oil Markets and Price Trends
Prevailing Oil Market Conditions
The low price volatility that prevailed in the oil and
energy markets between 2011 and 2014 was finally
shattered by the collapse in oil prices in the second half
of 2014. From a peak of $110 per barrel (bbl) in June
2014, dated Brent slid progressively to just $48/bbl
in January 2015 amid a growing over-supply in world
oil markets.
The over-supply has persisted so far in 2015. Brent has
traded in a range of $45-65/bbl since January, averaging
$58/bbl in the first half of 2015, despite a mild recovery
in the second quarter. While the collapse in prices in
2014-15 marked a return of oil price volatility, it may
be noted that the average Brent price in the first half
of 2015 matches the average over the last 40 years
(1975 to 2014), expressed in 2014 dollars. For reference,
Brent oil last sat in the $50/bbl range (in real terms)
more than a decade ago in 2004.
Lower prices have led to a dynamic adjustment of
supply, demand, stockholding and investment flows.
This process is now well under way and will continue
beyond the end of 2015, given the excess supply and
inventories that have built up in the market. A new
equilibrium price range may eventually be found but
market indications increasingly suggest that prices may
persist within the current range of $45-65/bbl well
beyond the end of 2015.
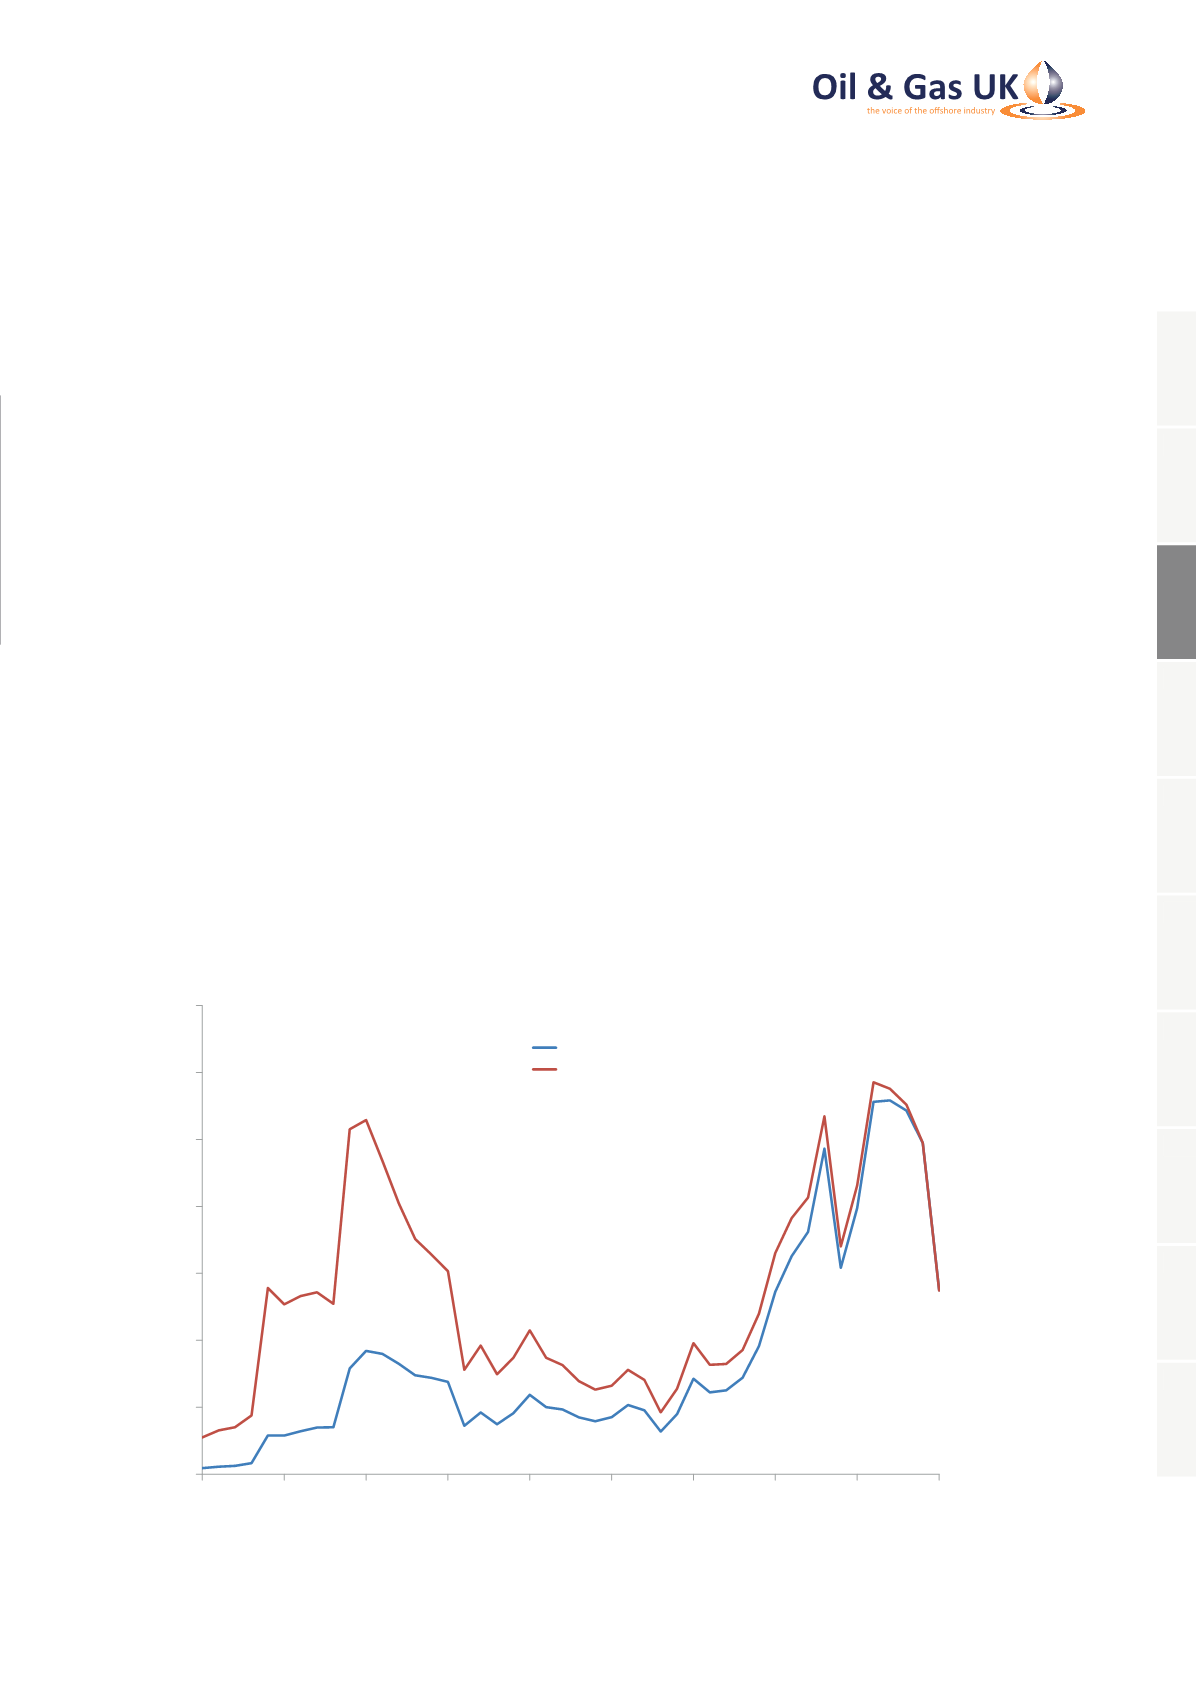
0
20
40
60
80
100
120
140
1970 1975 1980 1985 1990 1995 2000 2005 2010 2015*
Brent Oil Prices ($/bbl)
Brent Price (Nominal)
Brent Price (Real)
Source: Argus Media, BP
*2015 predicted average
Figure 1: Nominal and Real Brent Prices
3. Prices and Markets
1
2
3
4
5
6
7
8
9
10