


 17 / 88

ECONOMIC REPORT 2015
17
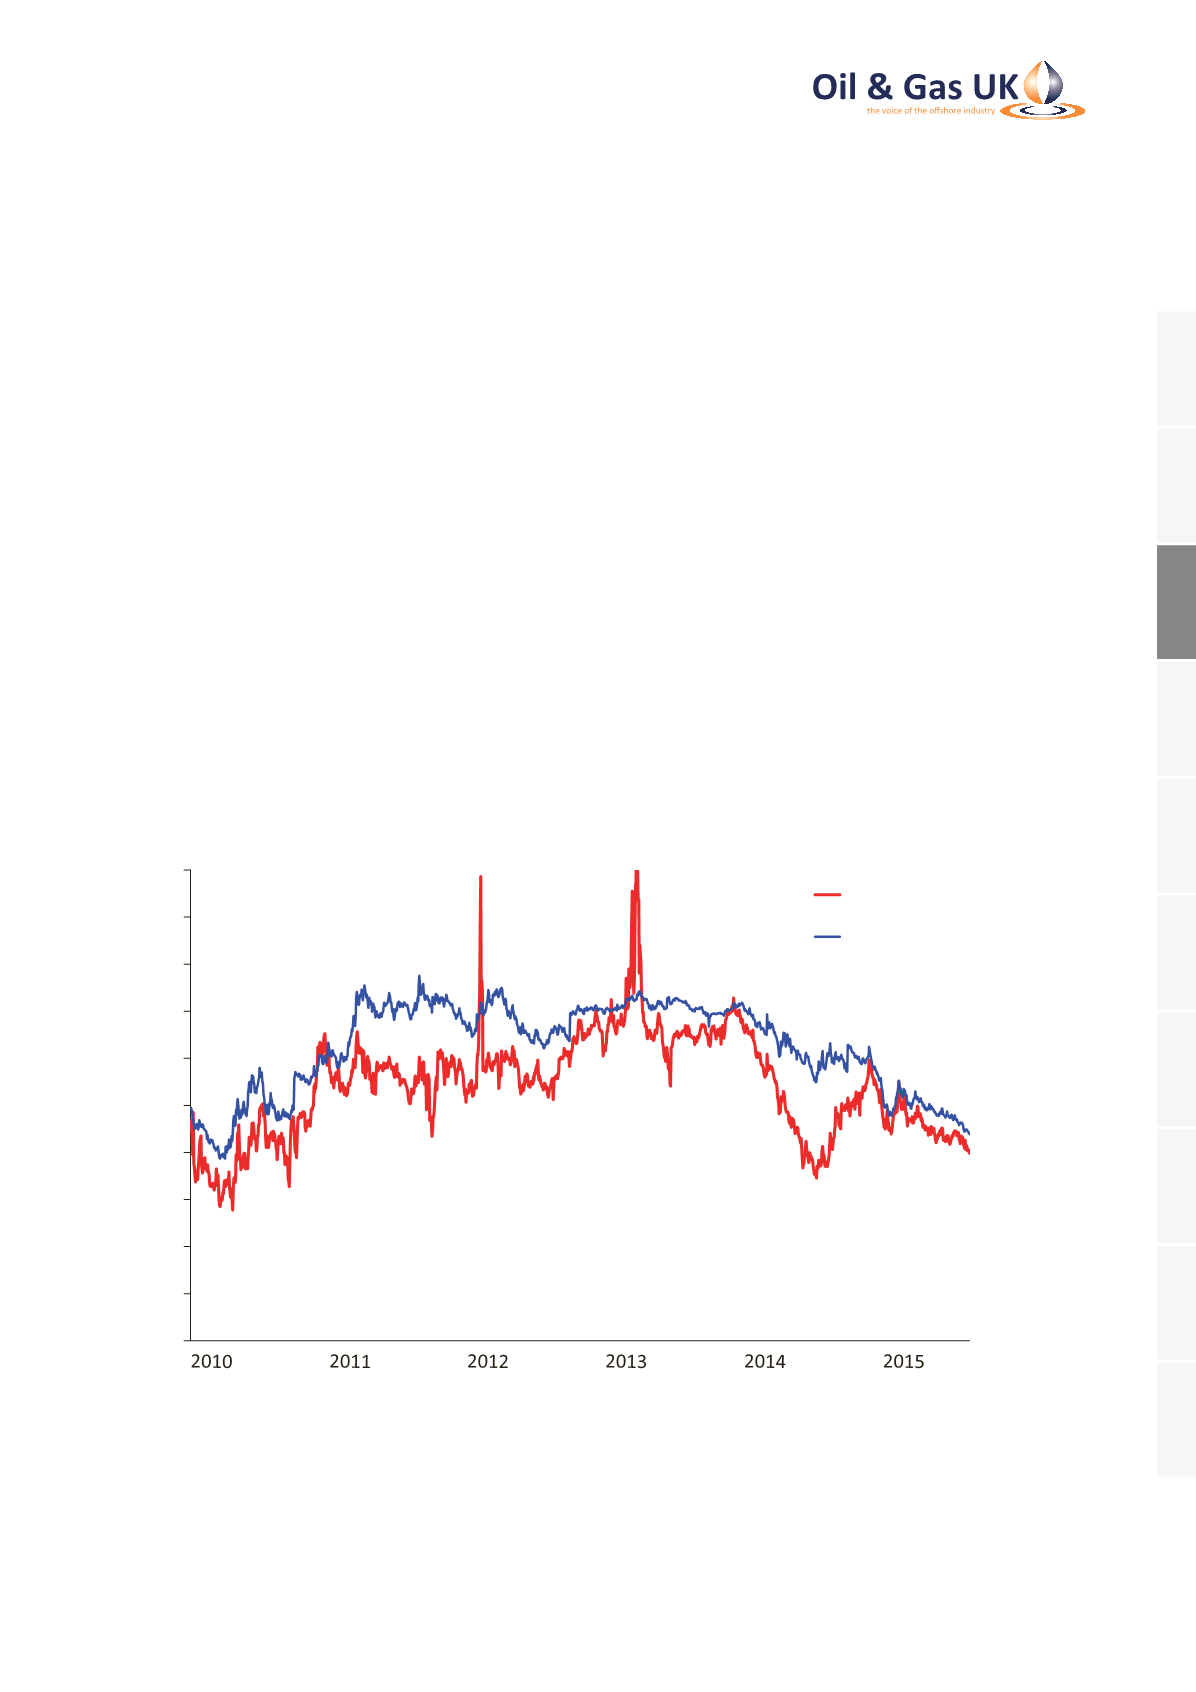
Average month-ahead NBP prices fell to a four-year low
of 51 p/th ($8.40/m BTU) in 2014, in response to acute
demand-side weakness rather than the collapse in oil
price. The influence of lower oil prices can be seen in the
progressive erosion of prices for delivery in the winter
of 2015-16 from 60 p/th in mid-2014 to 45 p/th at the
time of writing.
Prompt NBP prices in the summer of 2015 have so far
avoided the collapse seen in 2014, and the full-year
average is expected to be in the range of 42-49 p/th.
The slide in forward winter prices, despite the recent
severe restrictions on production from the large Dutch
Groningen field, indicates that there is adequate supply
in European gas markets even at times of peak winter
demand. Excess supply is conventionally kept in check
by export restraint by the holders of uncontracted
pipeline gas. This role of regulating supply and defending
NBP/TTF hub prices may be more difficult to perform
once new sources of LNG enter the market in late 2015
and 2016, unless European demand unexpectedly
reverses its policy-induced downward trend.
0
10
20
30
40
50
60
70
80
90
100
Gas Price (p/th)
Day Ahead
Front Winter
Source: ICIS Heren
Figure 7: Daily National Balancing Point Prices,
January 2010 to August 2015
1
2
3
4
5
6
7
8
9
10