


 16 / 88

ECONOMIC REPORT 2015
16
for about half the gas entering the NTS (67 bcm). NBP
prices are closely correlated with hub prices in adjacent
hub markets on the near-continent, notably Zeebrugge
and the Dutch TTF (Title Transfer Facility) market, and
reflect prevailing supply and demand conditions across
north-west Europe.
Although NBP prices respond to many of the same
influences as oil prices, the divergent behaviour of NBP
and oil price since 2014 to 2015 is worthy of note. UKCS
gas producers faced a major fall in NBP prices in the
first half of 2014, whereas the fall for oil producers was
concentrated in the last few months of the year.
Gas demand in Europe in 2014 fell 10.1 per cent to
452 bcm due to an exceptionally warm winter in
2013-14, the economic weakness of much of the
Eurozone, price-induced demand restraint and further
contraction of gas use for electricity generation in
favour of coal and renewables.
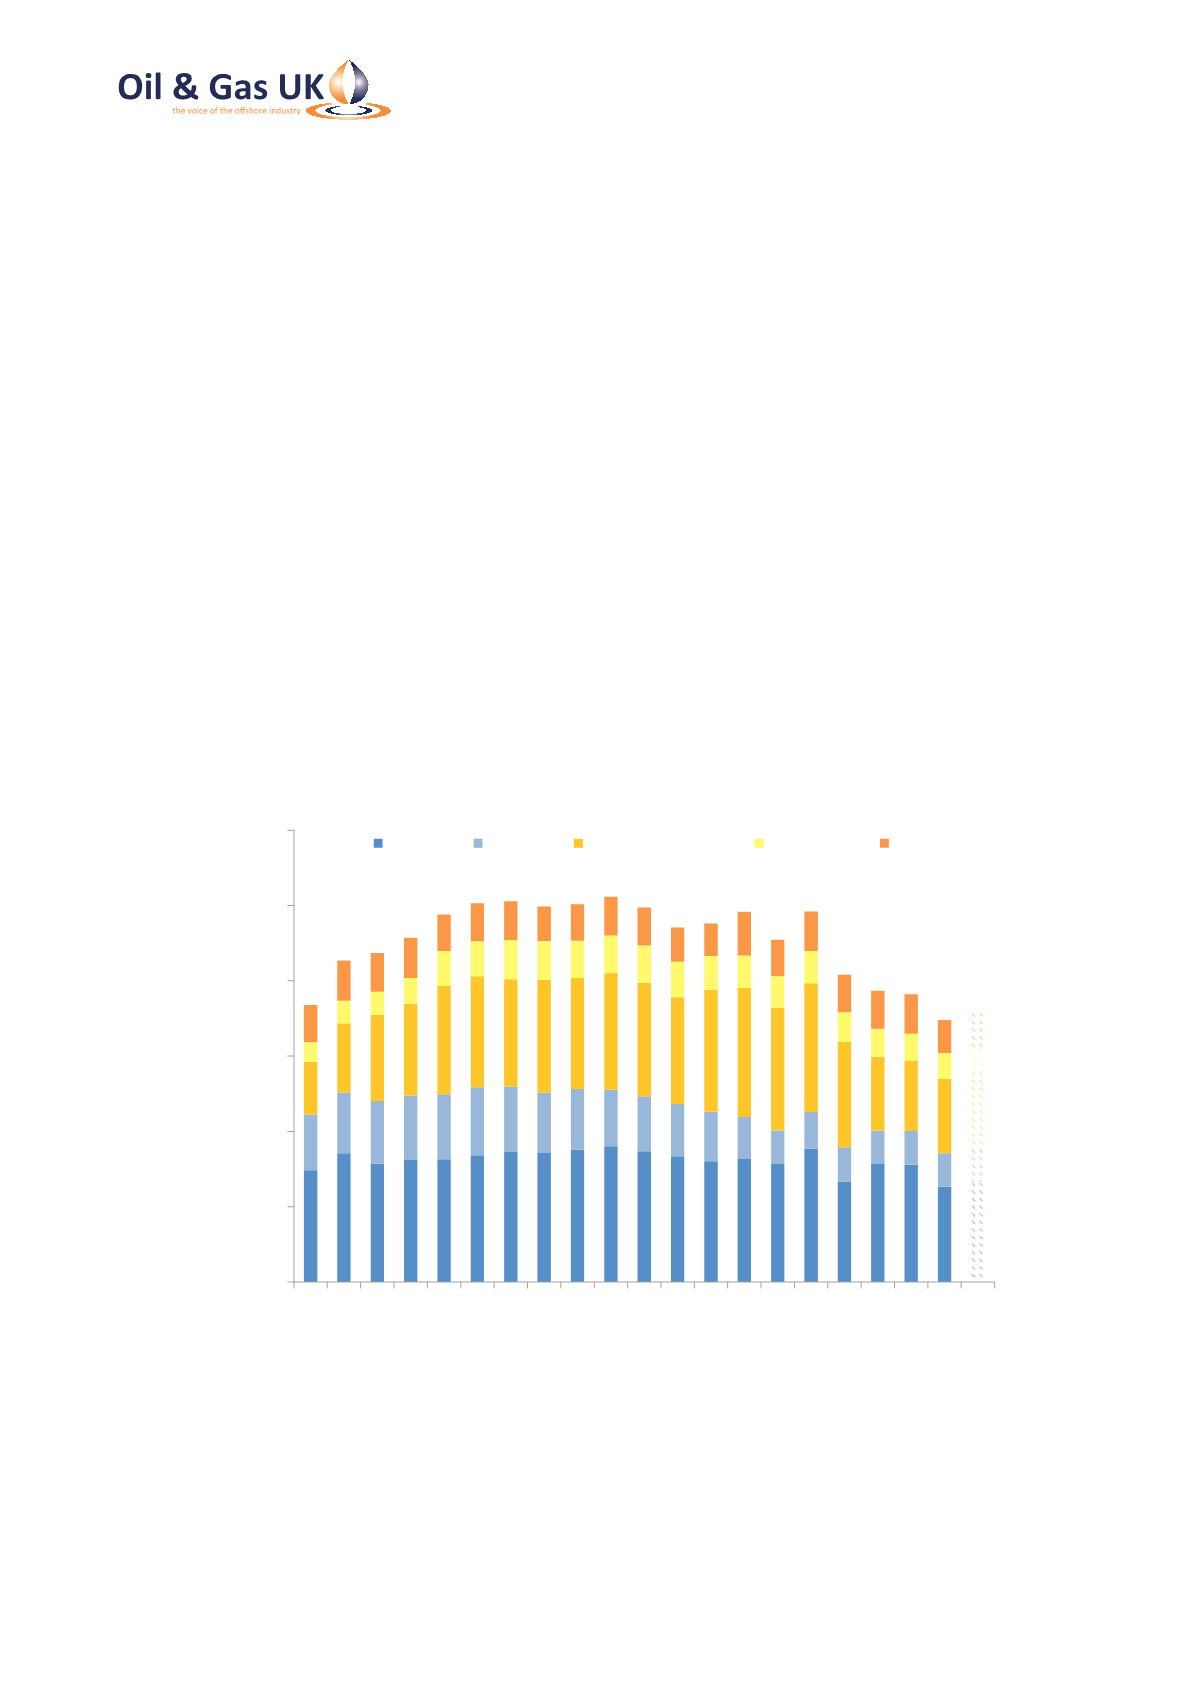
In the UK, total gas demand in 2014 was 70.2 bcm, the
lowest since 1994. Even if corrected to take account of
thewarmer-than-normal temperatures in 2014, demand
would only be estimated at 75 bcm. Unlike most other
EU countries, the UK recorded a slight increase in gas
use for electricity generation, from 18.7 bcm to 19.8
bcm, as gas picked up market share after the permanent
closure of old coal-fired plants. Based on provisional
data for the first six months of this year and normal
temperatures, UK gas demand in 2015 is expected to
rise modestly to 72.5 bcm (plus 3.2 per cent).
0
20
40
60
80
100
120
1995
2000
2005
2010
2015
Gas Balance (bcm)
Domestic
Industrial
Electricity Generation Other Energy
Services
Source: DECC, Oil & Gas UK projection
Figure 6: UK Gas Demand by Sector