


 15 / 88

ECONOMIC REPORT 2015
15
3.2 Gas Markets and Prices
Regional gas price convergence
Gas markets around the world are increasingly
inter-connected by liquefied natural gas (LNG) flows but
still remain largely regional in nature. There is therefore
no single world benchmark gas price of the kind
represented by North Sea Brent in oil markets. Pricing
of gas and LNG outside of North America is also marked
by a difference between term contract prices, many of
which remain linked to oil prices, and spot or hub prices
for uncontracted supply. Oil-indexation of contract
prices has diminished in Europe since 2009 as contract
terms have been progressively renegotiated but the link
still persists in Asian gas and LNG markets.
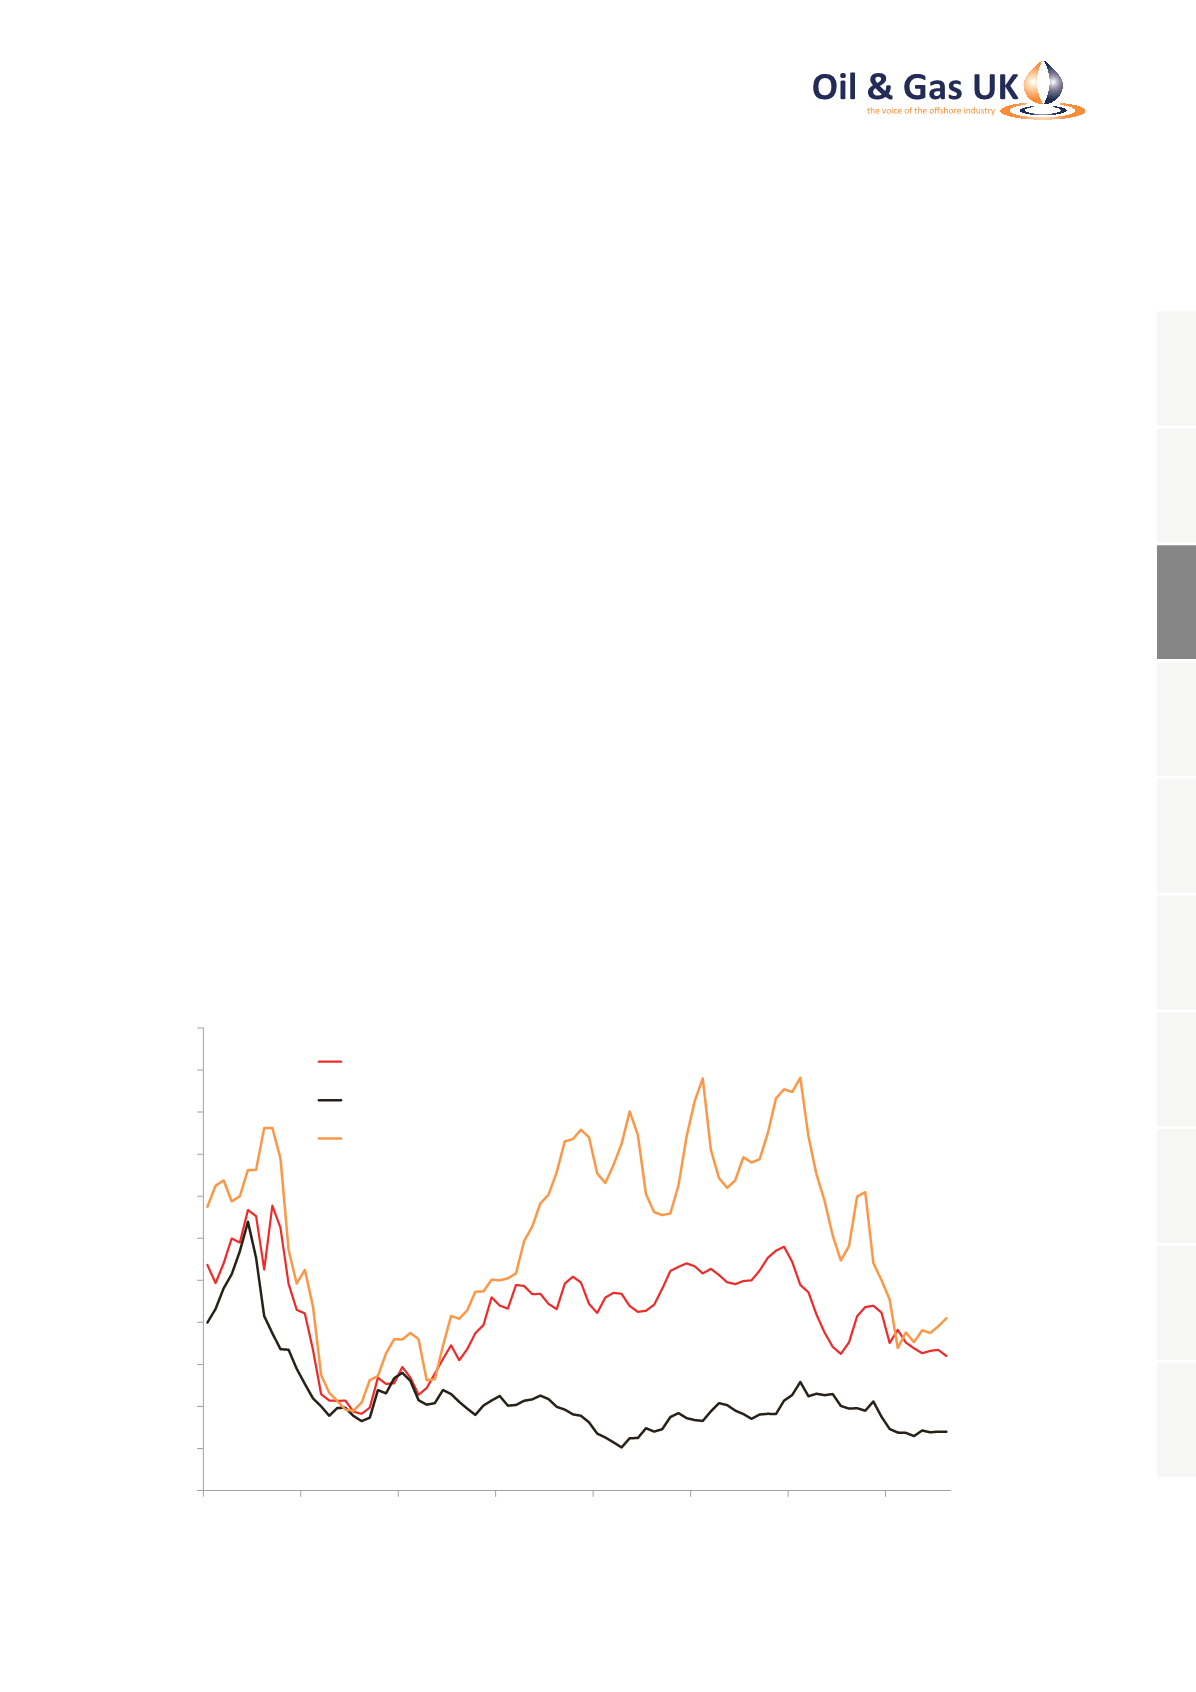
In 2014, there was a decline in traded gas and LNG
prices in all major regions and a convergence of Asian
and European markets, as illustrated in Figure 5.
However, we did not see the complete convergence of
all regional gas prices, as we did in 2009 in the depths
of the worldwide recession. The difference lies in the
contribution of the ‘shale gas revolution’ in lowering
the cost structure of North American supply and in
underpinning investment in new LNG export facilities
on the US Gulf coast. The first LNG exports from the
US are expected towards the end of 2015 when the
first train of Cheniere’s Sabine Pass liquefaction plant
is commissioned.
The sharp weakening of European hub prices and Asian
spot LNG prices preceded the collapse in oil prices,
but the decline was later reinforced by oil market
over-supply and low oil prices. By the beginning of this
year, the Asian spot price premium over NBP had almost
disappeared entirely after more than three years of
tightness in LNG markets. US gas prices, represented by
Henry Hub front month futures, also weakened from a
winter peak in the first quarter of 2014 and settled back
below $3/m BTU in 2015. The US economy continues
to enjoy a gas cost advantage over European and Asian
markets, which is reflected in much lower wholesale
electricity prices, but the advantage narrowed in 2014
to a level last seen in 2010.
UK NBP Wholesale Prices Reflect European
Demand Weakness
Almost all gas production from the UKCS is sold at
prices explicitly related to prices at the NBP, the virtual
hub based on the National Transmission System (NTS)
owned and operated by National Grid. In 2014, UK gas
production of 34.8 billion cubic metres (bcm) accounted
0
2
4
6
8
10
12
14
16
18
20
22
2008
2009
2010
2011
2012
2013
2014
2015
Gas Price ($/Million BTU)
NBP Month Ahead
Henry Hub Front Month
Far East Spot LNG
Source: ICIS Heren, NYMEX
Figure 5: Regional Gas and Liquefied Natural Gas Prices,
January 2008 to August 2015
1
2
3
4
5
6
7
8
9
10