


 12 / 88

ECONOMIC REPORT 2015
12
US Oil Production Expected to Peak in 2015
Analysis of the oil price collapse has naturally focused
on the US ‘shale revolution’ and the change in OPEC
market strategy against the background of a marked
slowdown in world oil demand growth in 2014.
Between 2010 and 2014, US crude oil production rose
from 5.5 million barrels per day (mb/d) to 9.5 mb/d as
tight oil output from shale formations grew steadily.
The effect of this investment-led increase in US output
was to reduce US import demand and to intensify
competition among crude oil suppliers in international
markets, especially those in the Atlantic Basin forced to
look for new buyers in Asia.
Since crude prices began to fall in mid-2014, the key
question in oil markets has been the extent and speed
of response from US tight oil production. The monthly
data from the US Energy Information Administration
(EIA) is beginning to provide some answers but market
opinion remains divided over the sustainability of US
tight oil output at an oil price of $40-60/bbl for WTI
(West Texas Intermediate).
US oil-directed drilling declined by 60 per cent between
October 2014 and mid-2015. However, total US tight oil
production continued to rise until April 2015, sustained
by existing financial hedging of cash flows, renewed cost
reduction in drilling and well completion, and a focus on
more productive plays. From April, output in the prolific
Bakken and Eagle Ford regions started to decline but the
larger Permian region had yet to record any reversal.
The EIA is now forecasting a modest decline in total US
crude production in 2016 for the first time since 2008,
coupled with an average Brent price of $54/bbl in 2015
and $59/bbl in 2016.
OPEC Holds Firm to New Market Strategy
OPEC’s decision in November 2014 to maintain its
production and restore its market share marked a
decisive moment in its recent history. The change of
market strategy to put pressure on high-cost sources
of non-OPEC supply was confirmed in June 2015 when
OPEC maintained its official ceiling of 30 mb/d and
continued to produce at more than 31 mb/d, almost
2 mb/d more than the underlying demand for its
crude oil needed to balance the short-term market.
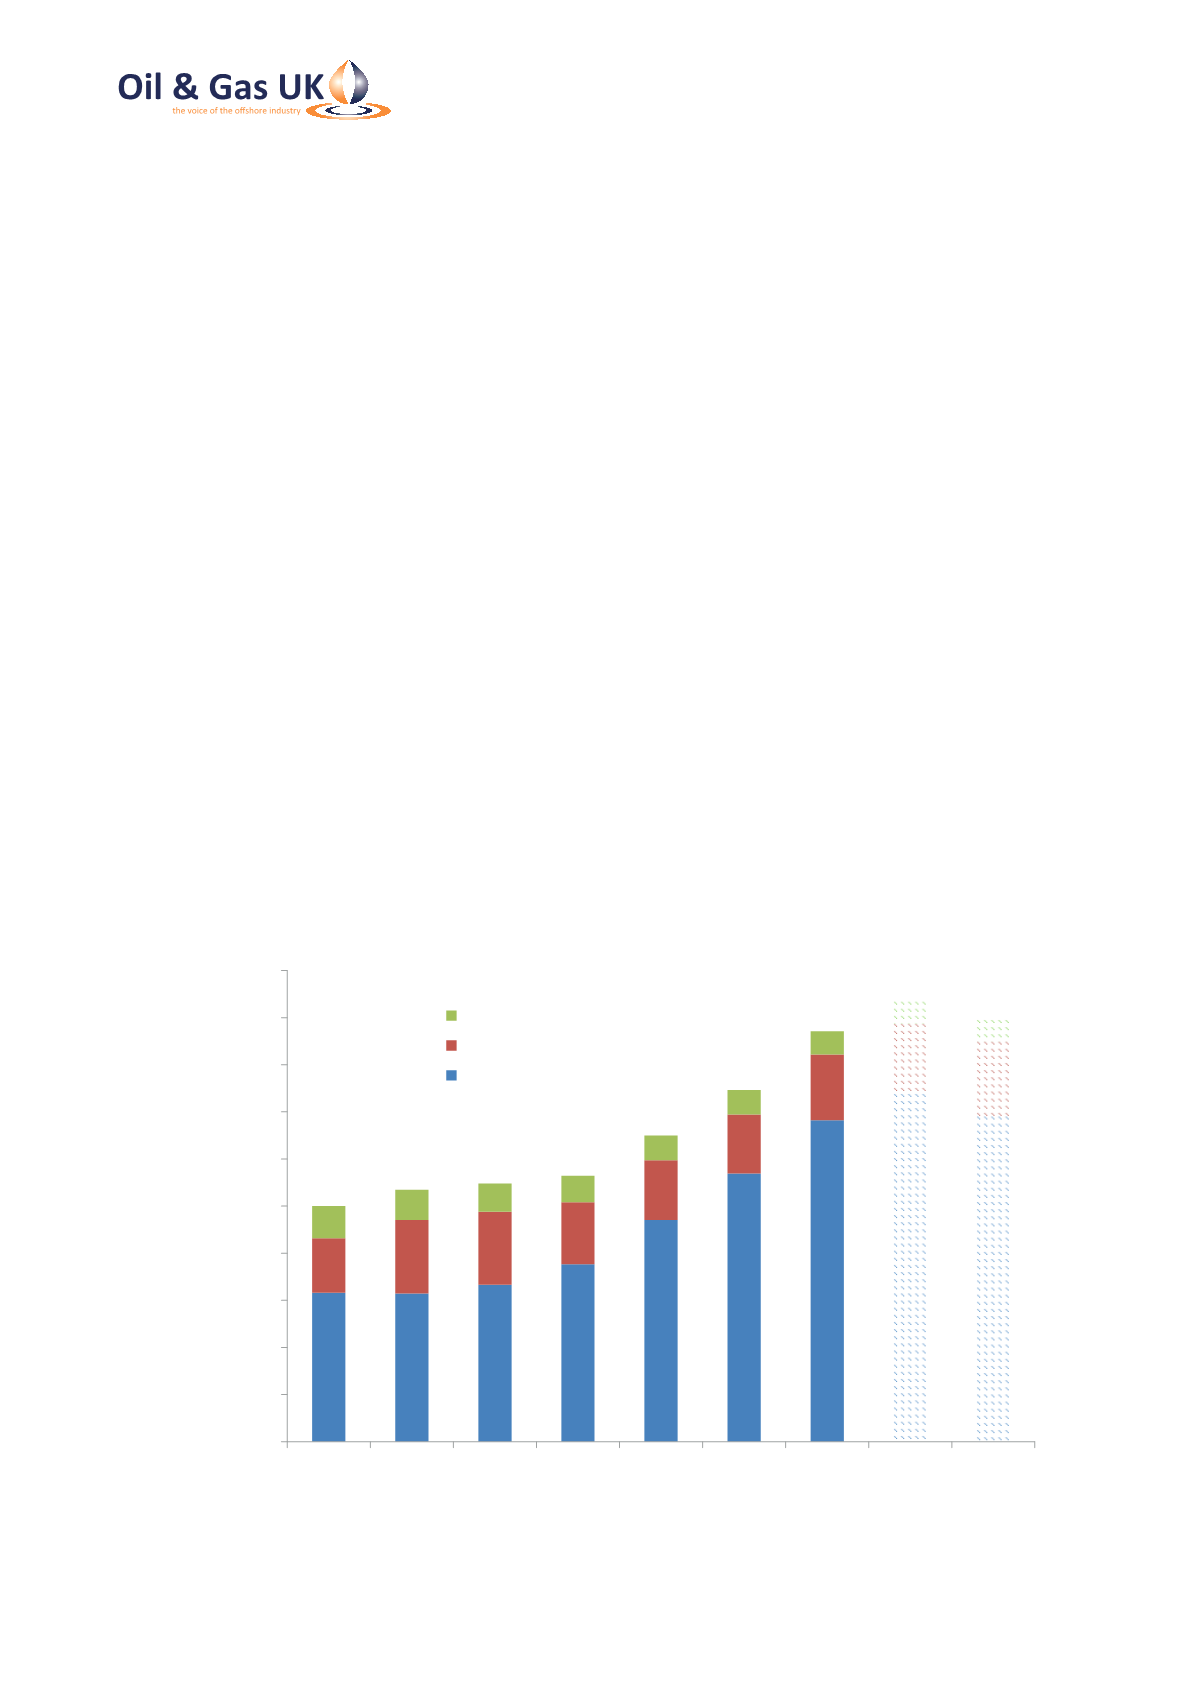
0
1
2
3
4
5
6
7
8
9
10
2008 2009 2010 2011 2012 2013 2014 2015 2016
Total Production (Billion boe)
Alaska
Gulf of Mexico
Lower 48 Onshore
Source: EIA (Short Term Energy Outlook August 2015)
Figure 2: US Crude Oil Production