


 24 / 88

ECONOMIC REPORT 2015
24
greater demand for supply chain services; and reduced
efficiency (greater effort expended to achieve a
given output).
In 2014, unit operating costs (UOCs) averaged £17.80/
boe ($29.30) and development costs £13.60/boe ($20).
Total operating expenditure increased by just under
£1 billion to reach a record £9.7 billion in 2014,
while capital investment was at an all-time high of
£14.8 billion (see Section 7 on performance indicators).
Turnover across the supply chain also peaked. While
data for 2014 are not yet available, EY
3
shows that
turnover across the UK supply chain rose to over
£39 billion in 2013 (up 62 per cent compared to 2008),
of which 42 per cent (over £16 billion) was in the export
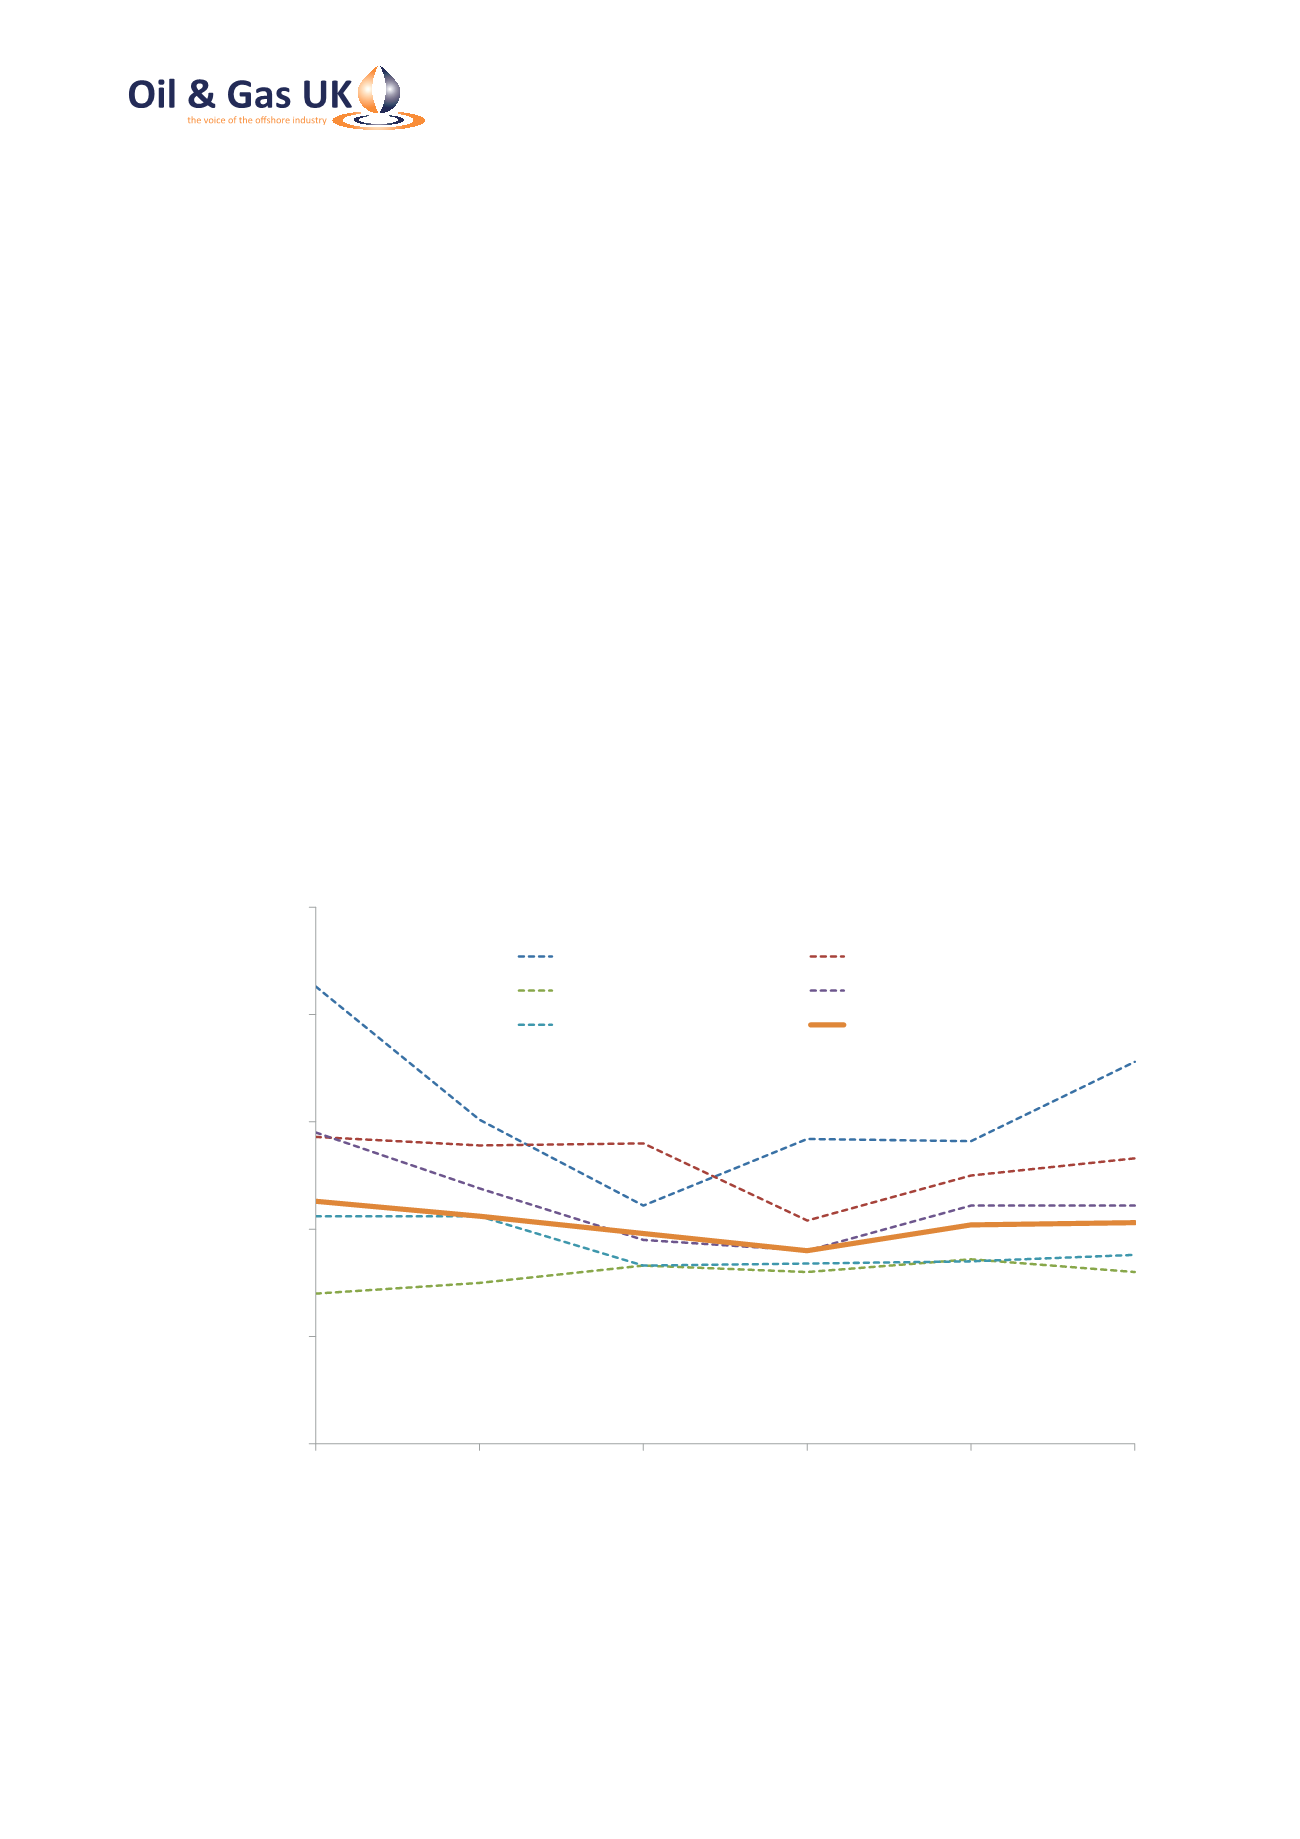
of goods and services. In contrast, EBITDA (earnings
before interest, tax, depreciation and amortisation)
margins across the supply chain remained similar to
previous years, averaging 10.3 per cent as a whole. This
illustrates that while turnover has grown considerably
over the last five years, profitability across the sector
did not increase over the same period.
5.2 Creating a Sustainable Business
As the oil price has fallen sharply over the last year,
also driving gas prices down, revenues from the UKCS
declined significantly to £25.2 billion on a gross basis in
2014, around 20 per cent lower than they were in the
previous year. Based on current price trends, revenues
in 2015 could be a further 30 per cent lower than last
year, despite strong production performance.
0
5
10
15
20
25
2008
2009
2010
2011
2012
2013
EBITDA Margin (%)
Reservoirs
Wells
Facilities
Marine and Subsea
Support and Services
Total Margin
Source: EY
Figure 11: EBITDA Margins for Sectors of the UK Supply Chain
3
The
Review of the UK Oilfield Services Industry (
March 2015)
,
published by EY, is available to download at
www.ey.com