


 10 / 16

10
MULTIFAMILY INVESTMENT SOUTH FLORIDA TEAM
| SOUTH FLORIDA
Cushman & Wakefield
PALM BEACH
MULTIFAMILY MARKET SUMMARY
YEAR
$ SALES VOLUME
# OF
SALES
TOTAL #
OF UNITS
ASKING
RENT
ASKING
RENT
PSF
ASKING
RENT
GROWTH
EFFECTIVE
RENT
EFFECTIVE
RENT PSF
EFFECTIVE
RENT
GROWTH
VACANCY
NET
ABSORP
NEW
UNITS
2017 (YTD) $46,875,000
5
68,476 $1,411 $1.39 0.6% $1,387
$1.37
-0.3% 6.3% 406 118
2016
$1,266,145,979 51
68,358 $1,402 $1.38 4.6% $1,391
$1.37
4.4% 6.9% 593 2,020
2015
$832,152,724
42 66,966 $1,340 $1.33 8.1% $1,333
$1.32
7.8% 6.0% 1,685 2,097
2014
$482,599,189
35 64,904 $1,240 $1.23 5.6% $1,236
$1.22
6.4% 5.6% 1,843 2,021
2013
$273,242,418
22 63,042 $1,174 $1.16
5.5% $1,162
$1.15
5.8% 5.7% 2,700 2,746
2012
$354,481,000 21
60,308 $1,113
$1.11
4.3% $1,098
$1.09
3.6% 6.0% 960 416
2011
$282,395,600 15 59,905 $1,067 $1.07 1.8% $1,060
$1.06
1.8% 6.9% 776 716
2010
$268,935,358 11
59,224 $1,048 $1.05 2.4% $1,041
$1.04
2.6% 7.3% 1,275 466
2009
$121,138,414
10 58,804 $1,023 $1.02 -2.1% $1,015
$1.02
-2.1% 8.8% 630 673
2008
$100,031,000 9 58,392 $1,045 $1.05 -3.0% $1,037
$1.04
-3.0% 9.2% 21
488
$45 MILLION $9.4 MILLION $147 PSF
$137,381
2017 Sales (YTD)
YTD Average Sale Price
YTD Median Sale PSF
YTD Median Sale per Unit
$1,411
93.7%
406 UNITS
68,476 UNITS
Average Rent Per Unit
Occupancy Rate
Annual Unit Net Absorption Inventory of Rentable Units
Palm Beach Apartments Under Construction
12
apartment buildings
totaling
3,634
units under construction
in Palm Beach
BUILDING
CITY
# OF
UNITS
EXPECTED
COMPLETION
Altis Boca Raton
Boca Raton
513
2018
Allure Boca
Boca Raton
282
2018
500 Ocean
Boyton Beach
341
2017
Alta Delray Station
Delray Beach
284
2017
Brightline Station Apts.
West Palm Beach 290
2018
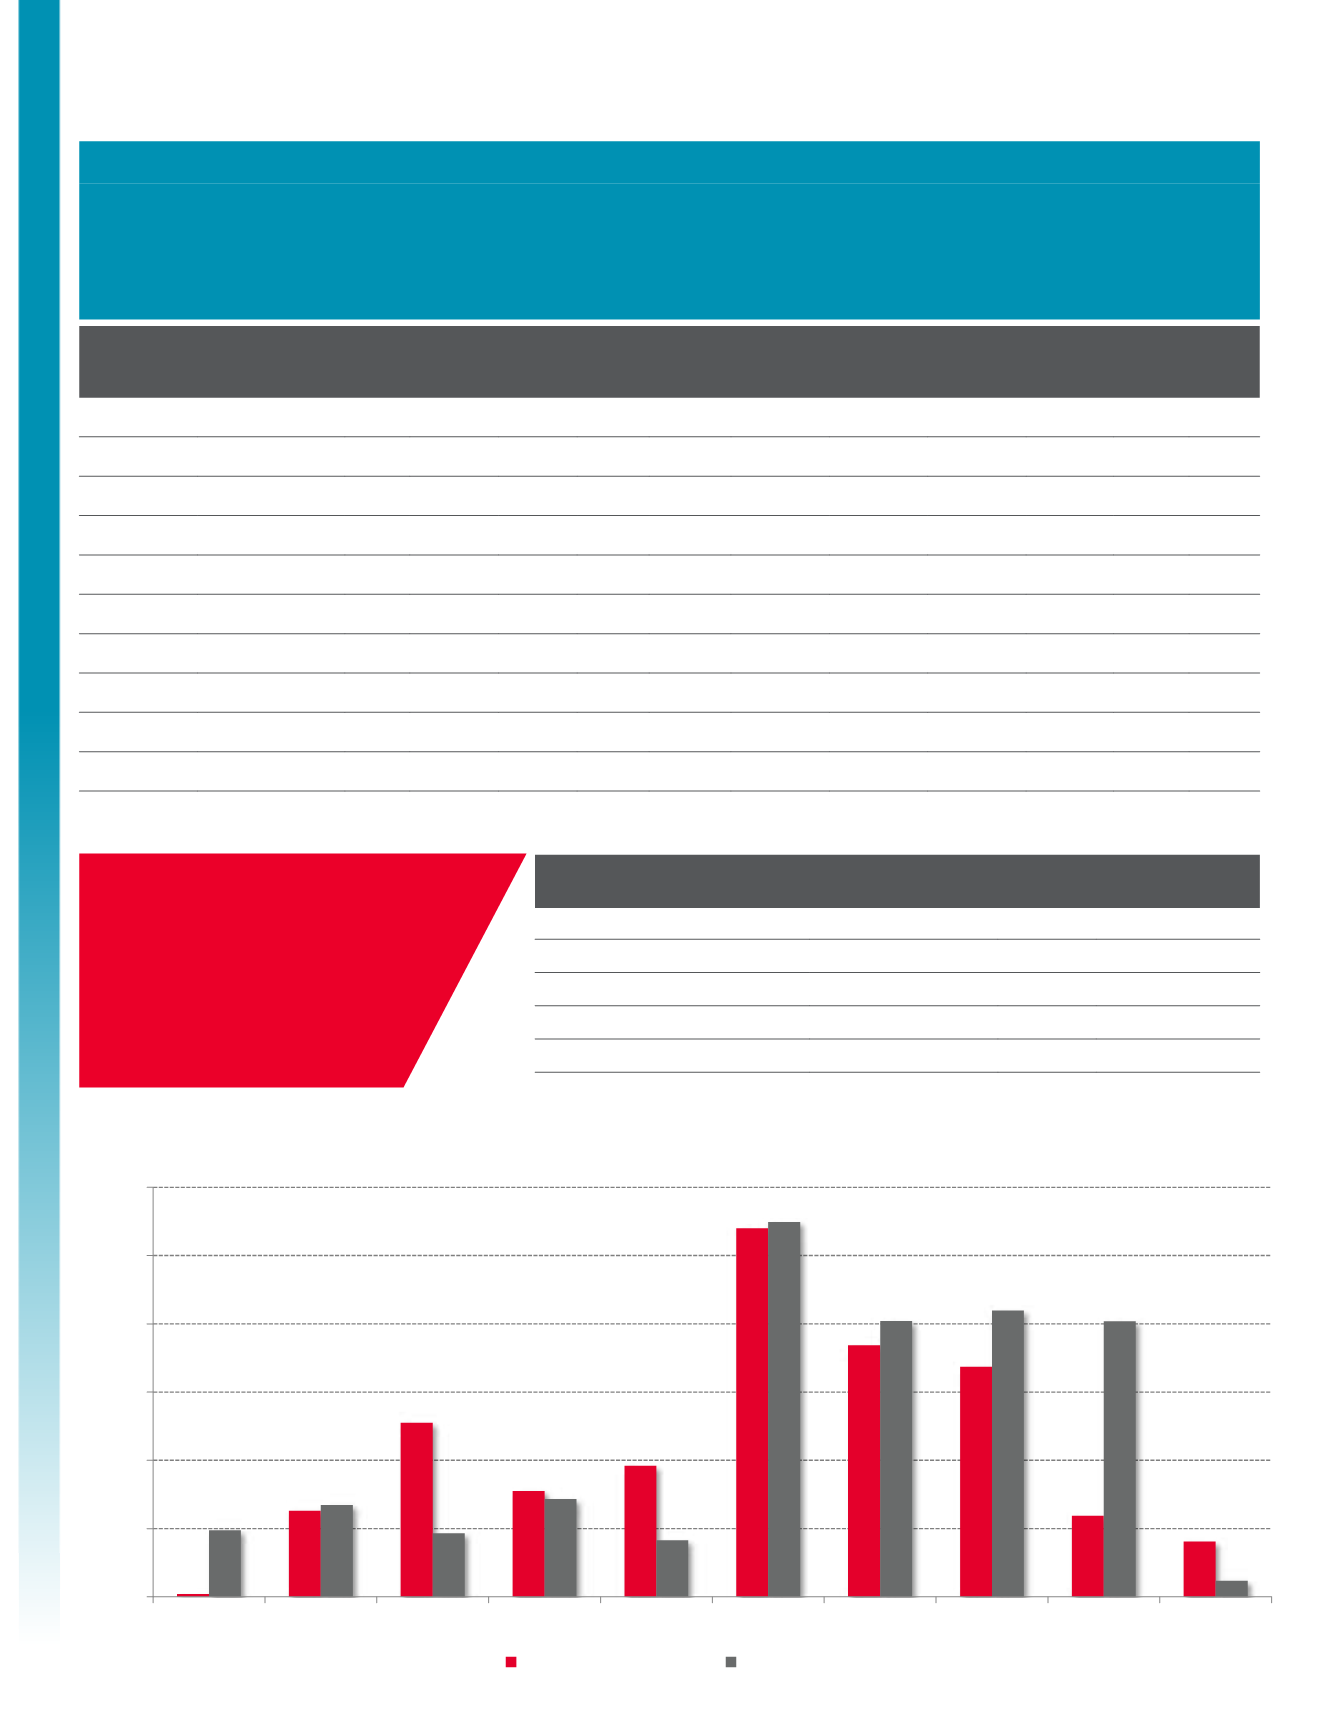
Palm Beach Deliveries Versus Absorption
0
500
1,000
1,500
2,000
2,500
3,000
2008
2009
2010
2011
2012
2013
2014
2015
2016
2017 (YTD)
Net Absorption (Units)
Deliveries (Units)